|
|
Chairman's Desk
 |
| SHRI SATISH W. WAGH |
| Chairman, CHEMEXCIL |
|
| |
Dear Member-Exporters,
I have pleasure to bring to you the 25th issue of the CHEMEXCIL e-Bulletin for the month of May 2018, which contains the following activities undertaken by the Council and other useful information/EXIM Notifications, etc.
The GSTN has made facility available for online submission of the RFD-11(Letter of Undertaking) for FY 2018-19. Online submission of LUT will save time & transaction costs. Members now can apply online for LUT on the GST Portal.
The Jawaharlal Nehru Custom House(JNCH), NhavaSheva has constituted “Environment Protection Unit” & Compliance of E-Waste (Management) Rules, 2016, respectively.
CBIC has clarified the renewal of online Letter of Undertaking (LUT ) for 2018-19. The registered person (exporters) shall fill and submit FORM GST RFD-11 on the common portal. An LUT shall be deemed to be accepted as soon as an acknowledgement for the same, bearing the Application Reference Number (ARN), is generated online. No document needs to be physically submitted to the jurisdictional office for acceptance of LUT. An LUT shall be deemed to have been accepted as soon as an acknowledgement for the same, bearing the Application Reference Number (ARN), is generated online.
The DGFT has launched the facility to check status of Importer Exporter Code (IEC) application made to them.
I hope, you will find this news bulletin informative and useful. The Secretariat look forward to receive your valuable feedback and suggestions which will help us to improve this bulletin.
With Regards,
SHRI SATISH W. WAGH
CHAIRMAN,
CHEMEXCIL
Chairman Office:
SWASTIK INDUSTRIES
207/208, UdyogBhavan,
Sonawala Road, Goregaon (East),
Mumbai 400063, INDIA.
Tel.: +91-22-40332727
Fax: +91-22-26860011
E-mail: satish@supriyalifescience.com |
BACK |
|
Chemexcil’s Participation in Beauty World Middle East Exhibition held in Dubai, UAE during 8th to 10th May 2018
The 23rd Beauty World Middle East Exhibition wasa three day event held from 8th to 10th May 2018 at Dubai International Convention Centre (Formerly Dubai World Trade Centre), Dubai.
As the largest International Trade fair for beauty products, Hair, Fragrances in the Mid-East & Africa (MEA), this exhibition attracts more than 40,000 trade visitors and beauty professionals from across the world. The show provides the participants an opportunity to tap the lucrative beauty and personal care market in MEA which is valued at approximately USD 32.7 Bn (2017) and expected to grow by around 10% in future.
The 2018 edition of the show featured 1736 exhibitors from 62 countries spread overs a sprawling area of 61,000 sqm which is a growth of 11% over the previous year.
The show also had excellent international presence of 25 country pavilions including India, China, Thailand, Morocco, Turkey, USA, Pakistan, Korea, France, Singapore, Russia etc.
In order to promote exports of Cosmetics and toiletries from India and also to assist our members to explore the market potential in GCC countries, CHEMEXCIL along-with Indian Trade Promotion Organisation (ITPO) and Shefexcil had organised an India Pavilion booking space of 90 sqm each in Arena (Hall 2) reserved for International Pavilions. There were total 29 stalls in the Indian Pavilion, out of which 9 exhibitors had showcased their products under the umbrella of CHEMEXCIL.
The Indian Pavilion was also graced by H.E Shri Vipul, Consul General of India, UAE who interacted with the stall holders in the Indian Pavilion to understand about their activities in the MEA region.
Chemexcil stall holders were also pleased to interact with Shri Vipul and briefed him about their products, current exports to MEA etc.
The India pavilion attracted good visitor interest from Local buyers and also global business professionals/ dealers/ buyers etc from countries such as Kuwait, Saudi Arabia, Turkey, Jordan, Egypt, Pakistan, Nigeria, Russia etc. Indian exhibitors networked with them for tapping the future business opportunities.
Chemexcil’s stall inside the Indian Pavilion was also visited by several local and overseas Buyers/consultants/ service providers etc who were provided leaflets and information about the exhibitors in the Indian Pavilion and also about the activities of the council.
| |
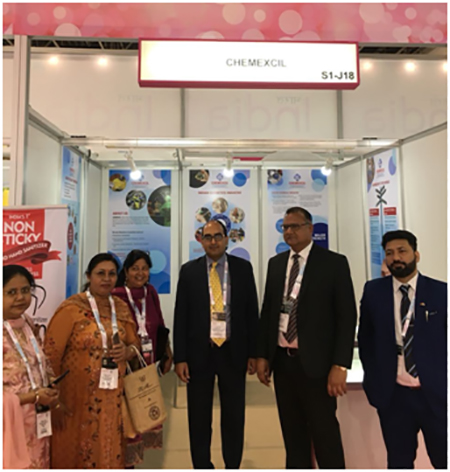 |
| H.E Shri Vipul, Consul General of India, UAE at CHEMEXCIL stall in Indian Pavilion |
BACK |
GST (Policy Wing)
Clarifications on refund related issues
| EPC/LIC/CBIC/IGST |
30/05/2018
|
| |
|
TO ALL THE MEMBERS OF COUNCIL
|
| |
|
GST
(Policy Wing)
Clarifications on refund related issues |
|
|
Dear Members,
The “GST Policy Wing, Central Board of Indirect Taxes and Customs” has issued circular No. 45/19/2018-GST dated 30/05/2018 regarding clarification on certain refund related issues.
The above-said circular provides clarifications for following queries:
Claim for refund filed by an Input Service Distributor, a person paying tax under section 10 or a non-resident taxable person.
Application for refund of integrated tax paid on export of services and supplies made to a Special Economic Zone developer or a Special Economic Zone unit.
Refund of unutilized input tax credit of compensation cess availed on inputs in cases where the final product is not subject to the levy of compensation cess.
Whether bond or Letter of Undertaking (LUT) is required in the case of zero rated supply of exempted or non-GST goods and whether refund can be claimed by the exporter of exempted or non-GST goods?
What is the scope of the restriction imposed by rule 96(10) of the CGST Rules, regarding non-availment of the benefit of notification Nos. 48/2017-Central Tax dated the 18.10.2017, 40/2017-Central Tax (Rate) dated 23.10.2017, 41/2017-Integrated Tax (Rate) dated 23.10.2017, 78/2017-Customs dated 13.10.2017 or 79/2017-Customs dated 13.10.2017?
The self-explanatory clarifications in detail pertaining to above queries are provided in the circular No. 45/19/2018-GST dated 30/05/2018.
Members are requested to take note. For further details, the above said circular is available for download/ reference using below link-
http://cbic.gov.in/resources//htdocs-cbec/gst/Circular_No.45.pdf
Thanking You,
Yours faithfully,
(S.G. BHARADI )
EXECUTIVE DIRECTOR
CHEMEXCIL
|
|
BACK
|
CBIC - Web-help service is now available on www.cbec-gst.gov.in for query resolution
| EPC/LIC/GST/SELF_SERVICE |
30/05/2018
|
| |
|
TO ALL THE MEMBERS OF COUNCIL
|
| |
|
CBIC - Web-help service is now available on www.cbec-gst.gov.in for query resolution |
|
|
Dear Members,
As per updates on CBIC Portal, a web-help service is now available on www.cbec-gst.gov.in for getting faster resolution of your queries.
Members can submit their queries by clicking the "SELF SERVICE" option under "HELP" tab in the top right of cbec-gst.gov.in .
Once you submit query, a reference number is generated for tracking/ monitoring.
Members are requested to take note of this new utility and use it accordingly. The link for SELF SERVICE" is provided as follows:
https://cbec-gst.gov.in/help.html
Thanking you,
Yours faithfully,
S.G BHARADI
EXECUTIVE DIRECTOR
CHEMEXCIL
|
|
BACK
|
Very Imp. - Sanction of pending IGST refund claims where the records have not been transmitted from the GSTN to DG Systems
| EPC/LIC/CBIC/IGST |
30/05/2018
|
| |
|
TO ALL THE MEMBERS OF COUNCIL
|
| |
|
Very Imp. - Sanction of pending IGST refund claims where the records have not been transmitted from the GSTN to DG Systems |
|
|
Dear Members,
As you are aware, there has been delay in processing/ credit of IGST refund on account of non-transmission of data from GSTN to customs.
One of the most common errors have been that total IGST payable is not specified correctly under Table 3.1(b) of GSTR 3B. It is either incorrectly mentioned under Table 3.1(a) or Table 3.1(c) of GSTR 3 B. Table 3,1(a) pertains to domestic supplies and Table 3.1(b) pertains to exports. Similarly, IGST submitted under Table 3.1(b) of GSTR 3 B is less than total IGST, payable through export invoices specified under Table 6A of GSTR 1 of that tax period. These errors have led to IGST validation failure on ICEGATE as data has not been transmitted from GSTN to ICEGATE.
Taking cognizance of the representations received from the exporter/ trade associations seeking resolution of problems which have hindered sanction of refund of IGST paid on exports, CBIC has issued Circular No. 12/2018-Customs dated 29/05/2018 whereby following procedure is being prescribed to overcome the problem of refund blockage. This would be an interim solution subject to undertakings/ submission of CA certificates by the exporters as given below and post refund audit scrutiny.
For the convenience of exporters, the procedure as proposed in the circular is reproduced/ highlighted as under:
A. Cases where there is no short payment:
(i) The Customs policy wing would prepare a list of exporters whose cumulative IGST amount paid against exports and interstate domestic outward supplies, for the period July’ 2017 to March’ 2018 mentioned in GSTR-3B is greater than or equal to the cumulative IGST amount indicated in GSTR-1 for the same period. Customs policy wing shall send this list to GSTN.
(ii) GSTN shall send a confirmatory e-mail to these exporters regarding the transmission of records to Customs EDI system.
(iii) The exporters whose refunds are processed/ sanctioned would be required to submit a certificate from Chartered Accountant before 31st October, 2018 to the Customs office at the port of export to the effect that there is no discrepancy between the IGST amount refunded on exports and the actual IGST amount paid on exports of goods for the period July’ 2017 to March’ 2018. In case there are exports from multiple ports, the exporter is at liberty to choose any of the ports of export for submission of the said certificate.
(iv) A copy of the certificate shall also be submitted to the jurisdictional GST office (Central/ State). The concerned Customs zone shall provide the list of GSTINs who have not submitted the CA certificate to the Board by the 15th November 2018.
(v) Non submission of CA certificate shall affect the future IGST refunds of the exporter.
(vi) The list of exporters whose refunds have been processed as above shall be sent to DG (Audit)/ DG (GST) by the Board.
B. Cases where there is short payment:
(i) In cases where there is a short payment of IGST i.e. cumulative IGST amount paid against exports and interstate domestic outward supplies together, for the period of July’ 2017 to March’ 2018 mentioned in GSTR-3B is less than the cumulative IGST amount indicated in GSTR-1 for the same period, the Customs policy wing would send the list of such exporters to the GSTN and all the Chief Commissioner of Customs.
(ii) e-mails shall be sent by GSTN to each exporter referred in para (i) above so as to inform the exporter that their records are held up due to short payment of IGST. The e--mail shall also advise the exporters to observe the procedure under this circular.
(iii) The exporters would have to make the payment of IGST equal to the short payment in GSTR 3B of subsequent months so as to ensure that the total IGST refund being
claimed in the Shipping Bill/GSTR-1(Table 6A) is paid. The proof of payment shall be submitted to Assistant/Deputy Commissioner of Customs in charge of port from where the exports were made. In case there are exports from multiple ports, the exporter is at liberty to choose any of the ports of export.
(iv) Where the aggregate IGST refund amount for the said period is upto Rs. 10 lacs, the exporter shall submit proof of payment (self-certified copy of challans) of IGST payment to the concerned Customs office at the port of export.
However, where the aggregate IGST refund amount for the said period is more than Rs. 10 lacs, the exporter shall submit proof of payment (self-certified copy of challans) of IGST to the concerned Customs office at the port of export along with a certificate from chartered Account that the shortfall amount has been liquidated.
(v) The exporter would give an undertaking they would return the refund amount in case it is found to be not due to them at a later date.
(vi) The Customs zones shall compile the list of exporters (GSTIN only), who have come forward to claim refund after making requisite payment of IGST towards short paid amount and complied with other prescribed requirements.
(vii) The compiled list may be forwarded to Customs policy wing, DG (Audit) and DG (GST). Customs policy wing shall forward the said list of GSTINs to GSTN. On receipt of the list of exporters from Customs policy wing, GSTN shall transmit the records of those exporters to Customs EDI system.
(viii) The exporters whose refunds are processed/ sanctioned as above would be required to submit another certificate from Chartered Accountant before 31st October, 2018 to the same Customs office at the port of export to the effect that there is no discrepancy between the IGST amount refunded on exports and the actual IGST amount paid on exports of goods for the period July’ 2017 to March’ 2018. A copy of the certificate shall also be submitted to the jurisdictional GST office (Central/ State). The concerned Customs zone shall provide the list of GSTINs who have not submitted the CA certificate to the Board by the 15th November 2018.
(ix) Non submission of CA certificate shall affect the future IGST refunds of the exporter.
Post refund audit
The exporters would be subjected to a post refund audit under the GST law. DG (Audit) shall include the above referred GSTINs for conducting Audit under the GST law. The inclusion of IGST refund aspects in Audit Plan of those units may be ensured by DG (Audit). In case, departmental Audit detects excess refunds to the exporters under this procedure, the details of such detections may be communicated to the concerned GST formations for appropriate action.
DG (GST) shall send the list of exporters to jurisdictional GST officers (both Centre / State) informing that these exporters have taken benefit of the procedure prescribed in this circular. The jurisdictional GST formations shall also verify the payment particulars at their end.
This Circular deals only with the cases where the records have not been transmitted by GSTN to Customs EDI system. Once the records are transmitted by GSTN to Customs System based upon the above mentioned procedure, the usual procedure adopted in case of sanction of IGST refunds would have to be followed. In cases where the errors like SB005, SB002, SB006 etc are encountered with the records so transmitted, the provisions of Circulars issued by Board earlier shall apply to them. Field formations may, therefore, take necessary steps to bring these changes to the knowledge of exporters.
Members are requested to take of this circular. For further details, the above said circular is available for download using below link-
http://cbic.gov.in/resources//htdocs-cbec/customs/cs-circulars/cs-circulars-2018/circ12-2018cs.pdf
In case of further updates in connection with this procedure, we shall let you know.
Thanking You,
Yours faithfully,
( S.G. BHARADI )
EXECUTIVE DIRECTOR
CHEMEXCIL
|
|
BACK
|
Imp - Details of embedded taxes across various states in the export value of the product which remain non-refunded
| EPC/LIC/DGFT/EXPORT_INCENTIVES |
29/05/2018
|
| |
|
TO ALL THE MEMBERS OF COUNCIL
|
| |
|
Imp - Details of embedded taxes across various states in the export value of the product which remain non-refunded |
|
|
Dear Members,
This is in continuation of our recent circulars requesting your valuable suggestions on WTO Compliant Export Incentives/ fine tuning of existing export promotion measures under FTP 2015-20 and Department of Commerce.
In this regard, the council has received communication from O/o DGFT HQ seeking inputs on embedded taxes across various states in the export value of the product which remain non-refunded.
As you might be aware, there are many types of central, state and local taxes like the taxes on energy/fuel consumed (such as electricity duty etc) in the manufacture/export of goods meant for exports.
It is requested that the inputs pertaining to your products as to the percentage cost of embedded taxes across various states in the export value of the product, which remain non-refunded by any existing schemes by the Central/State Governments may kindly be provided to us latest by 30/05/2018 (1st half) on e-mail id’s ed@chemexcil.gov.in, deepak.gupta@chemexcil.gov.in & balani.lic@chemexcil.gov.in.
Your timely replies will enable us provide the information to DGFT within the timeline of 30/05/2018.
Thanking you,
Yours faithfully,
S.G BHARADI
EXECUTIVE DIRECTOR
CHEMEXCIL
|
|
BACK
|
Banking issues / Financial problems faced while doing business with Russia
| EPC/LIC/RUSSIA |
28/05/2018
|
| |
|
TO ALL THE MEMBERS OF COUNCIL
|
| |
|
Banking issues / Financial problems faced while doing business with Russia |
|
|
Dear Members,
The Council has received communication from the FT-CIS Division, Department of Commerce, Ministry of Commerce & Industry regarding inputs/issues on banking and financial problems that are being faced by exporters while doing business with Russia.
We understand that the meeting of India-Russia Working Group on Banking and Financial Matters is scheduled to be held during August, 2018 and such issues can be taken up during the meeting.
Member-exporters are therefore requested to revert with inputs on Banking/ Financial problems related issues pertaining to Russia, if any.
Your replies be kindly sent to us (within a week) on e-mail id’s- deepak.gupta@chemexcil.gov.in & balani.lic@chemexcil.gov.in . Your early replies will be appreciated and enable us highlight the issues to the ministry for deliberations.
Thanking You,
Yours faithfully,
S.G. Bharadi
Executive Director
Chemexcil
|
|
BACK
|
ADD - Imposition of Definitive Anti-Dumping Duty on imports of Saturated Fatty Alcohols originating in, or exported from Indonesia, Malaysia and Thailand
| EPC/LIC/DOR/FAO |
28/05/2018
|
| |
|
TO ALL THE MEMBERS OF COUNCIL
|
| |
|
ADD - Imposition of Definitive Anti-Dumping Duty on imports of Saturated Fatty Alcohols originating in, or exported from Indonesia, Malaysia and Thailand |
|
|
Dear Members,
The Department of Revenue, Ministry of Finance has issued Notification No. 28/2018-Customs (ADD) dated 25/05/2018 regarding Imposition of Definitive Anti-Dumping Duty on imports of 'Saturated Fatty Alcohols” originating in, or exported from Indonesia, Malaysia and Thailand.
As per the Notification, The designated authority as per final findings vide notification No. F. No.14/51/2016-DGAD, dated the 23rd April, 2018, concerning 'Saturated Fatty Alcohols" falling under Chapters 29 and 38 and originating in, or exported from Indonesia, Malaysia and Thailand, has come to conclusion that:-
The product under consideration is exported to India from the subject countries below its associated normal value, thus, resulting in dumping of the product.
Some of the imports were also causing material injury to the domestic industry, and has recommended the imposition of definitive anti-dumping duty on the imports of subject goods, originating in or exported from the subject countries and imported into India, in order to remove injury to the domestic industry.
The anti-dumping duty imposed on exports of above product originating in, or exported from Indonesia, Malaysia and Thailand varies from NIL to USD 92.23/MT (depending on various exporters as per the above notification)
The anti-dumping duty imposed shall be effective for a period of five years (unless revoked, superseded or amended earlier) from the date of publication of this notification in the Official Gazette and shall be payable in Indian currency (@ exchange rate which is specified in the notification of the Government of India, in the Ministry of Finance, Department of Revenue, issued from time to time)
Relevant members importing above-said products are requested to take note of the same. The above said notification is available for reference/download using below link:
http://www.cbic.gov.in/resources//htdocs-cbec/customs/cs-act/notifications/notfns-2018/cs-add2018/csadd28-2018.pdf
Thanking You,
Yours faithfully,
S.G. BHARADI
EXECUTIVEDIRECTOR
CHEMEXCIL
|
|
BACK
|
CBIC - Applicability of IGST on goods supplied while being deposited in a customs bonded warehouse
| EPC/LIC/CBIC/BE |
28/05/2018
|
| |
|
TO ALL THE MEMBERS OF COUNCIL
|
| |
|
CBIC - Applicability of IGST on goods supplied while being deposited in a customs bonded warehouse |
|
|
Dear Members,
The Central Board of Indirect Taxes and Customs, GST Policy Wing has issued Circular No. 3/1/2018-IGST dated 25/05/2018 providing clarification on the applicability of Integrated Goods and Services Tax (integrated tax) on goods supplied while being deposited in a customs bonded warehouse.
As you might be aware, transfer/sale of goods while being deposited in a customs bonded warehouse" is a common trade practice whereby the importer files an into-bond bill of entry and stores the goods in a customs bonded warehouse and thereafter, supplies such goods to another person who then files an ex-bond bill of entry for clearing the said goods from the customs bonded warehouse for home consumption. In this regard CBIC had issued Circular No. 46/2017-Customs dated 24.11.2017 whereby the applicability of integrated tax on goods transferred/sold while being deposited in a warehouse (hereinafter referred to as the "warehoused goods") was clarified.
However, CBIC has received further queries regarding applicability of integrated tax on goods transferred/sold while being deposited in a warehouse (hereinafter referred to as the "warehoused goods").
In this regard, CBIC has issued above-said circular whereby it is clarified that integrated tax shall be levied and collected at the time of final clearance of the warehoused goods for home consumption i.e., at the time of filing the ex-bond bill of entry and the value addition accruing at each stage of supply shall form part of the value on which the integrated tax would be payable at the time of clearance of the warehoused goods for home consumption.
In other words, the supply of goods before their clearance from the warehouse would not be subject to the levy of integrated tax and the same would be levied and collected only when the warehoused goods are cleared for home consumption from the customs bonded warehouse.
This Circular would be applicable for supply of warehoused goods, while being deposited in a customs bonded warehouse, on or after the 1st of April, 2018.
Relevant members are requested to take note of the above circular and do the needful accordingly. The circular no Circular No. 3/1/2018-IGST dated 25/05/2018 is available for reference/ download using below link:-
http://www.cbic.gov.in/resources//htdocs-cbec/gst/igst-circu-3.pdf
Thanking You,
Yours faithfully,
(S. G. Bharadi)
EXECUTIVE DIRECTOR
CHEMEXCIL
|
|
BACK
|
Air Cargo Complex, Sahar, Mumbai Exporters whose Validation of Bank accounts by PFMS is still pending
| EPC/LIC/ACC/SAHAR/IGST |
24/05/2018
|
| |
|
TO ALL THE MEMBERS OF COUNCIL
|
| |
|
Air Cargo Complex, Sahar, Mumbai Exporters whose Validation of Bank accounts by PFMS is still pending |
|
|
Dear Members,
We have received communication from Assistant Commissioner of Customs, Air Cargo Complex, Sahar, Mumbai regarding Exporters whose Validation of Bank accounts by PFMS is still pending leading to hold up of IGST refunds.
We understand that despite various mailers in the past, several exporters have still not validated their bank accounts to be accepted by PFMS thereby resulting in non-disbursement of Refunds even after refunds being scrolled out in some of the cases.
The excel sheet with IEC’s of exporters (including Chemexcil members) who have not validated their bank accounts or found rejected by PFMS, is attached for reference.
Members exporting through Air Cargo Complex, Sahar, Andheri(E) Mumbai are requested to go through the attachment and in case they figure in the list, kindly revalidate their bank accounts duly accepted by PFMS so that refunds are credited.
For any issues, please contact Assistant Commissioner of Customs (Drawback), Air Cargo Complex, Sahar, Mumbai (Tel- 022-26816631/ 022-26816711, e-mail- jaideepdubey1@gmail.com, customs.dbkedi@gmail.com)
Thanking You,
Yours faithfully,
(S. G. Bharadi)
EXECUTIVE DIRECTOR
CHEMEXCIL
Encl : http://chemexcil.in/uploads/files/PFMS_(2).xlsx
|
|
BACK
|
DGFT - Maintenance of Annual Average Export Obligation under EPCG Scheme
| EPC/LIC/DGFT/EPCG |
24/05/2018
|
| |
|
TO ALL THE MEMBERS OF COUNCIL
|
| |
|
DGFT - Maintenance of Annual Average Export Obligation under EPCG Scheme |
|
|
Dear Members,
The O/o Directorate General of Foreign Trade has issued Public Notice No.10/2015-20 dated 22/05/2018 regarding flexibility in Maintenance of Annual Average Export Obligation under EPCG scheme.
A new para 5.19A will be inserted as under in HBP:-
5.19A : Maintenance of Annual Average Export Obligation
The excess exports done towards the average export obligation fulfilment of an EPCG authorization during a year can be used to offset any shortfall in the Average EO done in other year(s) of the EO period or the block period as the case may be provided Average EO imposed is maintained on an overall basis, within the block period or the EO period as applicable.
As an effect of this Public Notice, Export obligation under EPCG scheme has been made more flexible as non-maintenance of Annual Average in some years can be offset by excess exports in other year(s) in respect of EPCG authorisations.
Members are requested to take note of this relaxation and do the needful, wherever applicable. The said PN is available for download/ reference using below link:
http://dgft.gov.in/Exim/2000/PN/PN18/PN%2010%20eng.pdf
Thanking You,
Yours faithfully,
(S.G. BHARADI)
Executive Director
CHEMEXCIL
|
|
BACK
|
US GSP Details of Key Importers in USA
| EPC/LIC/US-GSP |
22/05/2018
|
| |
|
TO ALL THE MEMBERS OF COUNCIL
|
| |
|
US GSP Details of Key Importers in USA |
|
|
Dear Sir / Madam,
This is in continuation of our mailers dated 02/05/2018 & 07/05/2018 regarding US GSP Review and follow-up action to be undertaken.
So far we have received few responses and also hope the concerned companies have submitted the response online on USTR Federal Rulemaking Portal : https://www.regulations.gov with the docket Number, (The docket No. for India review is USTR-2018-0006). Please do forward us the copies of the submission for records.
We have just received communication from NAFTA Division, DoC seeking details of the key importers in USA so that the Indian Embassy could request them to file petitions (copy attached).
In view of the above, we kindly request you to provide the requested details so that the same could be provided to the NAFTA division. The replies be sent at the earliest to (ed@chemexcil.gov.in; adreach@chemexcil.gov.in & deepak.gupta@chemexcil.gov.in
Your immediate response / reply will be appreciated.
Thanking you,
Yours faithfully,
S G BHARADI
EXECUTIVE DIRECTOR
CHEMEXCIL
Enclosure:- GSP Letter
|
|
BACK
|
RBI EDPMS - Date for implementation of caution list extended till 30-Sep-2018
| EPC/LIC/EDPMS/EXTENSION |
21/05/2018
|
| |
|
TO ALL THE MEMBERS OF COUNCIL
|
| |
|
RBI EDPMS - Date for implementation of caution list extended till 30-Sep-2018 |
|
|
Dear Members,
As you are aware, caution listing on account of RBI-EDPMS has been a cause of concern as it impacts export shipments, document submission to buyers and also resultant business.
In this regard, the Commerce Secretary had recently convened a meeting with RBI and leading bankers to discuss various issues concerning the exports sector (including caution listing issue).
We understand that RBI’s representative has informed that the date for implementing the caution list in EDPMS has been extended till 30-Sep-2018.
Therefore, members are requested to take note of this relaxation and utilise this additional time up-to 30-Sep-2018 to clear such cases, if any.
In case issues still persist, do write to us on ed@chemexcil.gov.in and Deepak.gupta@chemexcil.gov.in
Thanking You,
Yours faithfully,
S.G. BHARADI
EXECUTIVE DIRECTOR
CHEMEXCIL
|
|
BACK
|
JNCH:- Important Public Notices issued (Pilot implementation of paperless processing under SWIFT/ Increase in the validity period of Chapter 3 Scrips/ Modification in the procedure of the Container Movement Permission etc)
| EPC/LIC/JNCH/PN’s |
18/05/2018
|
| |
|
TO ALL THE MEMBERS OF COUNCIL
|
| |
|
JNCH:- Important Public Notices issued (Pilot implementation of paperless processing under SWIFT/ Increase in the validity period of Chapter 3 Scrips/ Modification in the procedure of the Container Movement Permission etc) |
|
|
Dear Members,
Kindly note that the O/o Commissioner of Customs (NS-III) Mumbai Zone-II, Jawaharlal Nehru Custom House has recently issued several Public Notices regarding paperless processing under SWIFT, EODC for EPCG Authorisations, Increase in the validity period of Chapter 3 Scrips , procedure of the Container Movement Permission, SOP to be followed for Export and Import at Bharat Mumbai Container Terminal (BMCT), JNCH etc.
The relevant Public Notices issued are listed as follows for information:
PUBLIC NOTICE FOR 2018
Members are requested to take note of above-said PNs. For further details, members may use below link for reference/ download.
http://jawaharcustoms.gov.in/information.aspx?PageID=1161
Thanking You,
Yours faithfully,
(S.G. BHARADI)
Executive Director
CHEMEXCIL
|
|
BACK
|
Major problems which you are facing on export of your items to LAC countries?
| EPC:PROJ:LAC COUNTRIES: |
14/05/2018
|
| |
|
TO ALL THE MEMBERS OF COUNCIL
|
| |
|
Major problems which you are facing on export of your items to LAC countries? |
|
|
Dear Sir/Madam,
As you might be aware, that although India is emerging as an important player in the world trade, it’s importance in Latin America and Caribbean (LAC)has been much lower than several other competing countries in the region. India's presence in LAC is ranked low compared to other major trading countries in the region such as the US, the European Union and China. However, in recent years, India has accorded high priority to this region in its trade policy, despite important constraints such as distance factor and low level of current economic engagement with the region.
Notwithstanding above constraints, India has strong export potential to become an important trading player in LAC. It has been reported that prudent action plan is needed to develop regional strategies and accordingly, India can embark on LAC in future because it is an emerging market, with presence of large middle income groups, high resources, efficiency in production of agro products and expanding manufacture importing destination.
There is convergence of interest between India and LAC in the external sector engagement. Therefore, India expects its deep integration with Latin America for both trade and investment. India has not only maintained very high growth performance with the region, but also is providing large market access to countries in the LAC region. Moreover, region’s eagerness to engage with Asia is an added advantage for India to develop a long term strategy in trade and investment to integrate with the region.
India is in the quest of new markets for trade and investment as the country is poised to enter into a five trillion economy by 2030. In order to enable India to emerge as a major Player in the LAC region by 2030, the Ministry of Commerce &Industry desires to have a focus study evolving an export strategy.
Since you are one of the member-exporters of the items covered by CHEMEXCIL to the LAC countries, we would request you to kindly send us your detailed comments/views/suggestions on the following , so as to enable us forward a consolidated note to the Ministry of Commerce & Industry with our recommendation to increase exports of the items covered by CHEMEXCIL to the LAC Countries:-
What are the major problems which you are facing on export of your items to LAC countries?
Are you facing any Nature of NTBs in the LAC?
According to you, what are the major sectors/future markets for India’s exports and imports?
What is the Future potential in specific goods sectors?
Who are the major competitors in specific countries/RTAs/Sectors?
How to counter distance factor specially towards reduction of transaction cost?
How major trading partners are getting specific trade preferences in specific countries/RTAs through the Bilateral/Regional process?
According to you what is the country specific import interest of India ?
What type of benefit you require in your export product in LAC Countries ?
What are the constraints you are facing in case of investment in LAC?
What domestic policies are required by you to incentivise to invest in LAC countries?
Your suggestion as to which form of investment would induce you to invest in LAC and which form of investment would induce LAC firms to Invest ? – M&A, Joint Ventures .
Your suggestion/ direction if any on policy liberalisation to attract LAC investment in India.
You are also requested to give your last three year exports in LAC Countries. Please give country wise exports of last three years.
Your replies with requisite details on the above be sent to us at the earliest (within a week) on e-mail id’s ed@chemexcil.gov.in adreach@chemexcil.gov.in & Deepak.gupta@chemexcil.gov.in and will enable us prepare a comprehensive note to be sent to the Ministry to have useful discussion in their ensuing multi-Stakeholders meeting on India’s Engagement with LAC in Trade and Investment.
Thanking you and awaiting your immediate response on the above.<
Yours faithfully,
(S G BHARADI)
EXECUTIVE DIRECTOR
|
|
BACK
|
FSSAI / JNCH Additional list of HS Codes of Non-Food/ Out of Scope items (as per JNCH PN no. 71/2018)
| EPC/LIC/JNCH/FSSAI |
14/05/2018
|
| |
|
TO ALL THE MEMBERS OF COUNCIL
|
| |
|
FSSAI / JNCH Additional list of HS Codes of Non-Food/ Out of Scope items (as per JNCH PN no. 71/2018) |
|
|
Dear Members,
This is in continuation of our earlier circular dated 17/01/2018 informing you about List of “Out of Scope” items as provided vide JNCH Public Notice No 09/2018, dated 12.01.2018.
In this regard, JNCH (Nhava Sheva) have now issued Public Notice No. 71/2018 dated 02/05/2018regarding an additional list of HS CODE of Non Food Items for which out of scope certification was given in the past, which has been received from FSSAI.
As per above PN, it is being informed that except revised list of HS CODE and product description, as enclosed with the Public Notice No. 12/2018 dated 19.01.18 (Annexure-A1) and additional list as provided in this Public Notice (Annexure-A2), other content of Public Notice No 09/2018, dated 12.01.2018 remains unchanged.
Concerned members are requested to take note of this Public Notice. For details of items, the Public Notice No. 71/2018 dated 02/05/2018 is available for download using below link-
http://jawaharcustoms.gov.in/pdf/PN-2018/PN_071.pdf
In case of any difficulty, the specific issue may first be brought to the notice of Deputy/Assistant Commissioner in charge of Appraising Main (Import), NS-III (email address: appraisingmain.jnch@gov.in ).
Persistent difficulties, if any, can also be highlighted to us on e-mail id’s- deepak.gupta@chemexcil.gov.in & balani.lic@chemexcil.gov.in.
Thanking You,
Yours faithfully,
( S.G. BHARADI )
EXECUTIVE DIRECTOR
CHEMEXCIL
|
|
BACK
|
e-Way Bill Grievance Redressal Officers (CBIC and State / UT Governments) for e- way bill system under rule 138D of Central / State GST Rules, 2017
| EPC/LIC/E_WAY_BILL |
14/05/2018
|
| |
|
TO ALL THE MEMBERS OF COUNCIL
|
| |
|
e-Way Bill Grievance Redressal Officers (CBIC and State / UT Governments) for e- way bill system under rule 138D of Central / State GST Rules, 2017 |
|
|
Dear Members,
This is in continuation of our recent circulars regarding roll-out of e-way bill system for inter-state movement since 01/04/2018 and also phased roll-out of e-way bill system for intra-state movement in various states.
Kindly note that to address the issues/ grievances of tax payers, CBIC has issued the list of Grievance Redressal Officers (CBIC and State / UT Governments) for e-way bill system under rule 138D of Central/ State GST Rules, 2017.
Members are requested to take note of the same. The details of Grievance Redressal Officers (CBIC and State / UT Governments) for e-way bill system under rule 138D of Central/ State GST Rules, 2017 are available for reference/ download using below link:
http://www.cbec.gov.in/resources//htdocs-cbec/gst/Centre&State-GRO-rule_138-D.pdf
Thanking you,
Yours faithfully,
S.G BHARADI
EXECUTIVE DIRECTOR
CHEMEXCIL
|
|
BACK
|
Imp - Suggestions on WTO Compliant Export Incentives in lieu/ fine tuning of existing export promotion measures under FTP 2015-20 and Department of Commerce
| EPC/LIC/DGFT/EXPORT_INCENTIVES |
14/05/2018
|
| |
|
TO ALL THE MEMBERS OF COUNCIL
|
| |
|
Imp - Suggestions on WTO Compliant Export Incentives in lieu/ fine tuning of existing export promotion measures under FTP 2015-20 and Department of Commerce |
|
|
Dear Members,
As you are aware, in the recent times India has come under pressure from USA/WTO in connection with direct export incentives/subsidies (specially MEIS).
In this regard, O/o DGFT HQ has set up a committee to review Export Promotion measures under FTP 2015-20/ DoC and suggest remedial measures for fine tuning as per WTO norms. This committee is chaired by the DGFT himself and also comprises of representatives of TPD, IIFT, FIEO, EPCs etc. The committee also has state commissioners/ authorities via video conferencing to understand what subsidies states are offering.
The first meeting was held recently in New Delhi which was also attended by CHEMEXCIL representatives. The important points deliberated are as follows:
This meeting was mainly focused on discussing phase out/ fine tuning of incentives (specially MEIS) and explore possible other ways of WTO compliant export incentives which are not counter-vailable as India has crossed USD 1000 per capita criteria.
General perception amongst participants (specially academics) is that MEIS is not WTO Compliant. It was also felt that nowadays even state subsidies need to be relooked as some of them are counter-vailable.
Out of existing provisions, duty remission/ neutralization schemes advance authorization/ DBK are only somewhat WTO compliant and may be continued/ fine tuned. Similarly, state levies such as electricity duty etc can be neutralized, but only with proper justification/ workings.
Chemexcil representative submitted the points from chemical sector perspective. and also requested the committee that we should get level playing field vis.a.vis China as they are getting very high incentives. However, some of participants countered that incentive in China is not flat 13% but includes several hidden areas such as duty remission, land availability, subsidized power etc. Further, it was highlighted that if there was an issue with MEIS then to give some additional incentive in DBK which had come down in recent years despite no change in customs tariffs and also factor state levies such as electricity duty etc. We also requested them to provide support for registration costs, fighting anti dumping investigations, SPS-TBT measures etc
The group will keep discussing/meeting to submit report to DoC within 3 months.
In our view, our council should also discuss/ undertake study in this regard and suggest export promotion measures which are WTO-compatible and production-based, provide support for technology upgradation, capacity building and resolve infrastructure bottlenecks and move away from direct incentives to exporters.
Members are therefore requested to provide suggestions at the earliest (within a week) on ed@chemexcil.gov.in and deepak.gupta@chemexcil.gov.in to enable us submit the same to DGFT.
Thanking you,
Yours faithfully,
S.G BHARADI
EXECUTIVE DIRECTOR
CHEMEXCIL
|
|
BACK
|
US GSP - Review of US GSP benefit on exports from India
| EPC/LIC/US-GSP |
07/05/2018
|
| |
|
TO ALL THE MEMBERS OF COUNCIL
|
| |
|
US GSP - Review of US GSP benefit on exports from India |
|
|
URGENT AND IMPORTANT
Dear Member-exporters,
Kindly refer our earlier email dated 2nd May 2018 on the above subject. As stated therein, a stakeholders meeting was held under the chairmanship of Shri Shyamal Misra, IAS, Joint Secretary, Ministry of Commerce and Industry on 4th May, 2018 at New Delhi, on "Review of US GSP benefit on exports from India" and future course of action to be taken in this matter.
As you are aware, the United States (U.S.) Congress authorised extension of GSP benefit and currently India is one of the largest beneficiary under this programme. However, the extension of Generalised System of Preferences (US-GSP) program is a general extension.
As you may be aware, the United States Trade Representative (USTR) would be reviewing the eligibility of India and some other countries in the GSP. USTR notified that the review process for India is going to start as per details given below:
The Federal Register (FR) provides for interested parties to submit comments and hearing as per following timelines:
Ø 5 June 2018 - Deadline for interested parties to submit comments, pre-hearing briefs and request to appear in the public hearing.
Ø 19 June 2018:- The Trade Policy Staff Committee (TPSC) will hold a public hearing for interested parties.
Ø A transcript of the public hearing will be available on www.regulations.gov within approximately two weeks after the date of the hearing.
Ø 17 July 2018 - Deadline for interested parties to submit post-hearing briefs.
For India, GSP country eligibility review is based on concerns related to its compliance with GSP market access criteria which includes schedule for submission of public comments and a public hearing. It is understood that the US formally notified in Federal Register (FR) on 27.4.2018 initiating Country Practice Review of India regarding compliance with the GSP eligibility criteria.
We are enclosing herewith a list of the items which are coming under the purview of CHEMEXCIL with the MFN duties applicable against each product/HS code. If the US Office withdraws the GSP benefit of India, our exports will be adversely affected by the MFN duties mentioned against such products. We have also attached herewith FR notice announcing initiation of country practice reviews of India etc. which provides detailed information of submission.
Since you are one of the manufacturer-exporters to USA, you are requested to kindly go through the list of the items mentioned in the enclosure and send a representation directly through online submission to the USTR Federal eRulemaking Portal : https://www.regulations.gov with the docket Number, (The docket No. for India review is USTR-2018-0006) latest by 15/05/2018 with a copy to CHEMEXCIL (ed@chemexcil.gov.in; adreach@chemexcil.gov.in;deepak.gupta@chemexcil.gov.in )as well as the Ministry of Commerce & Industry (email : moc_epcap@nic.in) highlighting justifications on
a) items being exported by your company,
b) why GSP benefit should continue and
c) how the GSP importers into USA are benefiting US industry as most the items are intermediates and raw materials. If you have any other justification which can strengthen the case for continuation of US GSP benefits you can highlight the same in your representation.
In your representation being submitted to the USTR, you may also mention about not involvement of child labour in your industry, well defined labour law, India still a developing country, how it is helping employment generation and how it is helping the US importers as your products are raw materials and intermediates for the US industry who are doing value addition and manufacturing the value added / end products for the benefit to US consumers. Further, you can also impress upon your US importers to take up the same at their end also with USTR and send us a copy of such communication for our perusal.
Your immediate response / reply on or before 15th May, 2018 will enable us to update the Ministry of Commerce & Industry for taking up the matter with concerned authorities appropriately.
Thanking you,
Yours faithfully,
S G BHARADI
EXECUTIVE DIRECTOR
CHEMEXCIL
BASIC CHEMICALS, COSMETICS & DYES EXPORT PROMOTION COUNCIL
(Set-up by Ministry of Commerce & Industry, Government of India)
Jhansi Castle, 4th Floor, 7 Cooperage Road,
Mumbai – 400 001. India.
CIN : U91110MH1963NPL012677
Tel :+91-22-2202 1288/ 1330
Fax :+91-22-2202 6684
URL : www.chemexcil.in
Twitter : @chemexcil
Enclosure:- Copy of USA IMPORT FROM INDIA UNDER GSP PROGRAM (4)
FR notice announcing initiation of country practice reviews India Indonesia Kazakhstan (2)
|
|
BACK
|
e-Way Bill Notification regarding e-Way Bill for Intra-state Movement of Goods in Maharashtra
| EPC/LIC/E_WAY_BILL |
02/05/2018
|
| |
|
TO ALL THE MEMBERS OF COUNCIL
|
| |
|
e-Way Bill Notification regarding e-Way Bill for Intra-state Movement of Goods in Maharashtra |
|
|
Dear Members,
Kindly note that the Commissioner of State Tax, Maharashtra has issued notification no. 15C/2018-State Tax dated 25/04/2018 amending an earlier notification No. 15A/2018 –State Tax dated 27/03/2018 which stated that on or after the 1st April 2018, no e-way bill shall be required to be generated, for the intra-State movement that commences and terminates within the State of Maharashtra, in respect of any goods of any value. As per clause 2 of the earlier notification, the notification shall be in force until further orders are issued.
However, the notification dated 25/04/2018 has amended clause 2 and the same has been extended till 30th May 2018.
This would imply that from 31st May 2018 onwards e-way bill shall become a requirement for the intra-State movement that commences and terminates within the State of Maharashtra.
Members are requested to take note and do the needful accordingly. The said notification is enclosed herewith for your reference. In case of any further changes, we shall update you.
Thanking you,
Yours faithfully,
S.G BHARADI
EXECUTIVE DIRECTOR
CHEMEXCIL
Encl : http://chemexcil.in/uploads/files/E_WAY_Bill_Intrastate.jpg
|
|
BACK
|
Fair Trade and the World Trade Organization
|
May is World Trade Month, a time to recognize and echo the importance of global trade, particularly fair trade. As we kickoff World Trade Month here at USDA, it’s important to acknowledge that trade is on our minds not only during May but every single day of the year. Our work supporting fair trade is a 24-hour job as few industries depend more upon – and benefit more from – trade than American agriculture.
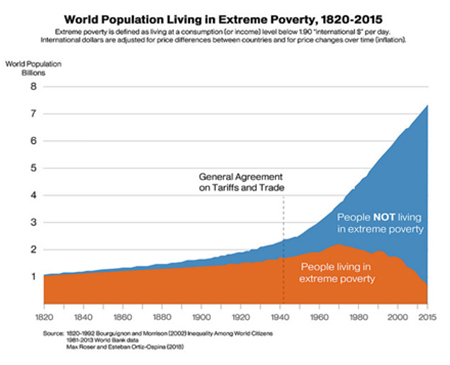
It’s not an understatement to say that the gains from trade are powerful. When people produce what they are best at, and trade it for things they are less adept at producing, both sides benefit. Historically, economic integration in the post WWII era delivered immense benefits. Trade is not the only reason, but it is a major factor in helping the number of people living in extreme poverty fall to record lows and become dwarfed by the number of people not living in extreme poverty.
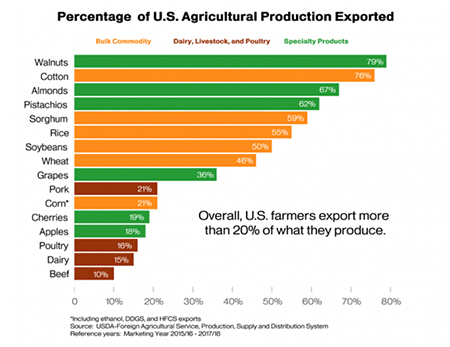
For U.S. agriculture, this success story is also a profitable one. Our farmers are the best in the world and we produce way more than we can consume. For many commodities, a significant share of U.S. production is exported. Without customers overseas, we would have huge surpluses, which would drive down prices, and result in hardships for our farmers that would ripple throughout the rural economy.
| |
 |
For me, these data raise two questions. First, since trade is good, what can we do to encourage more of it? Second, while trade is clearly good, how can we ensure it is fair? More specifically, while society as a whole benefits from access to foreign customers and the availability of imported goods, what can we do to protect particular industries from losing out to unfairly traded goods from foreign competitors? After working on trade policy for over 25 years, my view is that the answer to both of these questions is the same – a strong set of rules operated through a multilateral institution.
| |
 |
Importance of the WTO
Fortunately, we have a strong set of rules paired with an effective institution to both lay down rules for trade and enforce them – the World Trade Organization (WTO). WTO rules have been agreed to by 164 countries, including all the important trading nations, and have helped reduce barriers to trade that have powered the impressive growth in trade and expansion of world income. The core rules of the WTO are straight-forward and intuitively fair.
You may wonder how did these rules come about? Following the great depression and WWII, leaders in the United States recognized the importance of guarding against trade restrictions and wanted to expand trade to rebuild the world’s economies and foster closer diplomatic relations. Working initially with a small group of like-minded countries, a set of trade rules were agreed to in 1947, called the General Agreement on Tariffs and Trade (GATT). These rules were so successful that over time more countries joined the agreement, committing to follow the rules for trade among members of the GATT and also finding ways to negotiate reductions in trade barriers, principally tariffs. Building on this success, in 1994 the GATT was converted to the WTO, with further rules agreed to and, importantly, a binding dispute settlement system established.
The GATT, and now the WTO, have both helped expand trade and have established a set of rules that define ‘fair trade.’ So, what are those rules?
Key Rules Supporting Fair Trade
When I was a guppy government worker my former colleague Kevin Brosch once summarized the core rules for fair trade to me: three-and-a-half rules of the GATT. They are both strong rules to guard against trade restrictions and are also manifestly fair. They promote fair trade by limiting government restrictions and legitimizing the trading system. Here in a nutshell are the key rules:
1. Don’t discriminate across suppliers. The first article of the GATT ensures ‘Most Favored Nation’ treatment for all members. Basically that means that an importing country can’t treat one supplier less favorably than the treatment it provides its most favored supplier. For example, if the United States imposes a 5 percent tariff on mango imports from the Philippines, and that is the lowest tariff it applies on mangoes, India is ensured that it will not be subject to a tariff higher than 5 percent. Or, if the United States requires imported peaches from Argentina to be allowed in without fumigation, we can’t require imported peaches from Chile to be fumigated prior to entry. This ensures fair treatment across supplying countries.
2. Tariffs are the only justifiable tool for protecting domestic markets. The second article of the GATT says non-tariff measures like quotas, bans, and variable import restrictions are prohibited. Countries can however use tariffs, but they are set at maximum levels (for example the U.S. tariff on beef cannot exceed 26.4 percent). By establishing tariffs as the basis for regulating trade, the rules ensure more transparency and predictability and also facilitate negotiations between countries to bring down trade restrictions. It is really as simple as a negotiation over numbers!
3. Don’t discriminate against imports. The third article of the GATT protects imported products from facing requirements or taxes that are less favorable than those imposed on domestic products. For example, if the United States imposes a 15 percent excise tax on U.S. whisky, it can’t impose an excise tax higher than 15 percent on imported products. Or, if the United States says U.S. beef can be sold in grocery stores, convenience stores, and wholesale markets, imported Korean beef cannot be restricted to just be sold through convenience stores. This ensures imports are not restricted arbitrarily from the market. A key exception is tariffs (imports can be taxed while domestic products are not), which is covered next.
3.5 Subsidies. The WTO rules on subsidies are weaker, so I call it a half rule. Subsidies are permitted, with some exceptions. For example, export subsidies (which are government payments that help exporters win sales in international markets) are banned. While some subsidies are permitted, if an importing country shows that the subsidies are leading to increased imports from the subsidizing country, and injuring the importing country’s domestic industry, it can ‘remedy’ the situation by imposing restrictions –counter-vailing duties. Similarly, if a country is selling its product at a less than fair value, an importing country can restrict imports through anti-dumping duties. This rule recognizes that subsidies are pervasive instruments of government policy, but aims to control the negative impacts. This is easier said than done. China’s unjustified use of these trade remedies to unjustifiably restrict U.S. sorghum exports this year shows how these rules can be twisted for protectionist purposes.
Exceptions to the Rules and Enforcement
Is that it? Not quite. The WTO rules run for hundreds of pages and these three-and-half rules account for less than 1 percent of all the rules. The rest of the rules are exceptions to these rules. For example, countries agree to not discriminate across suppliers, however, if there is a threat to health or safety from imports, the trade rules allow the importing country to discriminate against imports from the impacted country. For example, if an exporting country is suffering from a disease outbreak that could spread to an importing country, a country may ban imports of the dangerous product from the exporting country, even as it imports from another supplier and continues to allow domestic commerce of the same product. The rules do lay out provisions to ensure this ‘health and safety’ exception is not abused: before imposing a trade restriction the importing country must complete a scientific risk assessment and it can’t arbitrarily impose overly restrictive measures. This can be pretty complicated!
Similarly, there are exceptions that allow countries to discriminate across supplies by forming Regional Trade Agreements. This allows the United States to eliminate tariffs on Mexican and Canadian imports, while maintaining them on other countries, like the European Union. There are conditions that a Regional Trade Agreement must substantially cover all trade to guard against arbitrary commercial preferences aimed at disadvantaging other countries. This rule has allowed countries to enter Free Trade Agreements which have helped boost global trade and expand incomes.
There are tons of these exceptions: goods made from prison labor can be banned, countries can impose technical standards, in times of a currency crisis countries can restrict imports to protect foreign currency reserves, and many more. My main point is these are good rules. If we were going to start from scratch today and try to identify a set of trade rules, I believe we could not do better than the ones agreed to through the GATT and WTO process. The proof is in the pudding – despite shortcomings, global trade has boomed under this system, and these rules have protected against abuse of the trading system by protectionist interests.
One last comment regarding fair trade, rules are only as good as their enforcement provisions. The WTO agreement of 1994 set up a dispute settlement system to give the rules real teeth. If a country believes a trading partner is violating the rules, it can request a panel of experts to here the merits of the case and render a judgement. If the policy is found to be inconsistent with trade rules, the offending country needs to resolve the violation. If it does not, the injured country can impose trade sanctions to retaliate.
The WTO dispute process has been very successful for U.S. agriculture. The threat of litigation keeps countries honest for the most part and has helped us negotiate reforms in other countries when they have caved to the temptation to cheat. The United States has initiated numerous WTO cases and in all instances we have either successfully negotiated a settlement or have prevailed in litigation. This has led to policy reforms by our trading partners, and kept markets open for our products. Even when countries have found it politically impossible to reform, such as the infamous EU hormone ban, we have been able to send a strong signal to other trading partners to not imitate bad behavior, and even in the EU we have negotiated compensatory import access. Other countries have also challenged some of our policies, but much less frequently than we have used the litigation option, and they have not challenged core U.S. farm or trade policies. We currently have two important disputes on China’s grain policies working their way through the WTO now – a positive outcome should give us leverage to encourage market-oriented reforms in China.
The WTO rules have served U.S. agriculture well. There are important areas were improvement is needed: too many high tariffs restrict trade, too many countries use very distorting price supports and input subsidies, and rules need to be strengthened with respect to unjustified non-tariff measures. Additionally, some countries have been circumventing WTO obligations for protectionist purposes, undermining the trading system. What U.S. agriculture, and the world, needs is a stronger and more useful global trading system.
(Source: https://www.fas.usda.gov/newsroom/fair-trade-and-world-trade-organization dated 1st May-2018)
|
|
BACK |
India must become globally competitive in manufacturing to boost merchandise exports
|
As the government never fails to point out, India is the fastest growing major economy, and expects to grow even faster in the coming years. It has liked talking about record FDI inflows, and how India is one of the most attractive investment destinations. What it doesn't like talking about is its dismal track record on merchandise exports.
In 2013/14, India's merchandise exports stood at $314.4 billion. In the next year, it fell to $310.3 billion. And the next year, 2015/16 saw a further fall to $262.3 billion before it improved marginally to $275.9 billion in 2016/17. This financial year, it has clocked $302 billion, which is still lower than what it was four years ago.
Some bit of the export drop can be blamed on falling crude prices. Petroleum products including high speed diesel forms a biggish chunk of Indian exports, and when crude prices fall, so do exports. But beyond that, India's merchandise exports are still in gems and jewellery, agriculture & allied, textiles, chemicals and transport equipment and machinery and base metals. Of these, exports of gems &jewellery, transport equipment and textiles actually fell in the current year.
In the past two years, India has not been able to take advantage of rising world trade. The disruptions caused by demonetisation first, and later the hiccups during the roll out of GST, have been blamed for hitting small exporters in a number of sectors.
The bigger problem though, in my opinion, is India's failure to get become globally competitive in manufacturing. So far, most countries that have grown rapidly have depended on globally competitive manufacturing to power them to high growth. In Asia, especially, Japan showed the way initially when its manufacturing techniques powered it to become a global manufacturing powerhouse in sectors ranging from autos, to consumer durables to imaging. Later the Asian Tigers, especially Taiwan and South Korea grew rapidly because of their engineering and manufacturing competitiveness. Then came the rise of China, which became the production base for all sorts of products from steel to solar panels, and from mobile phones to computers.
India has never managed to get its manufacturing act right despite many tries. At different times, the reasons proffered have ranged from higher raw material and electricity costs, low productivity of labour, difficulties in setting up greenfield factories because of land acquisition and government clearances, and other sundry reasons.
The problem has always been that India has always been proud of its small and medium industries and the jobs it created. For a long time, a range of products were reserved for the SME sector. Thankfully that reservation has gone now, but the natural inclination to look tilt on the side of SMEs and not large scale manufacturing has remained. Even this government continues that mindset probably because of the assumption that SMEs will continue to create more jobs than bigger manufacturers.
There are multiple problems with that assumption. SMEs are generally not globally competitive when it comes to production of high value products. Economies of scale and productivity problems plague them. But merchandise exports will not go up unless the products are globally competitive and can take a bite out of the global market. And that is where the policy makers need to focus on when they unveil the new industrial policy, which has been in the works for some time.
Focusing on giving benefit packages for exporters in textiles, and other such sectors will not make India a big merchandise exporter. And that is something this government will have to keep in mind when it finalises the policy.
(Source:-https://www.businesstoday.in/opinion/prosaic-view/india-must-become-globally-competitive-in-manufacturing-to-boost-merchandise-exports/story/276100.html dated 2nd May-2018)
|
|
BACK |
Utilising Free Trade Agreements for what they mean to business
|
Free Trade Agreements (FTAs) are rising in prominence, abeit laden with challenges. A cursory glance into the origin and evolution of FTAs over the past centuries would explain how and why. A specialised and updated information system designed for storage and processing of all the important information pertaining to FTAs is essential to overcome the various challenges in effectively utilising them.
FTA is an agreement facilitating trade between countries by reducing or even eliminating various tariff and non-tariff barriers to trade. It opens up new markets for industries to expand their sales outreach to. FTAs can also include in their scope or sphere of influence, areas such as foreign investment, economic growth, employment, infrastructure development, intellectual property rights, protectionism and international competition among others. Hence the different forms and terms, other than FTA, associated with Trade Agreements namely, PTA (Preferential Trade Agreement), CECA (Comprehensive Economic Cooperation Agreement), CEPA (Comprehensive Economic Partnership Agreement), Trading Bloc, Customs Union, Economic Union, Common Market, and so on.
For India alone, the various trade agreements and treaties, both in force as well as under negotiations, involve countries across regions as far-flung as Asia, Central America and South America. Of late, mutual efforts in advancing FTAs between India and a vast variety of countries and regions have been gathering speed, particularly with Nordic countries, South Korea, Egypt, European Union, Canada, Poland, Switzerland, France, Israel, United States, Great Britain, Mauritius, Singapore and Vietnam.
In the aftermath of World War II, a new global economic order was created by General Agreement on Tariffs and Trade (GATT) in 1947, forcing economic powers out of protectionism and globally institutionalising the idea of multilateralism.
Countries became independent and so did their economic decision-making. There came about an increase in awareness of their trade interests which could be served by FTAs. WTO (World Trade Organization) replaced GATT in 1995. Signed by 123 and currently with 162 member states, it is the largest international economic organisation in the world regulating trade in goods, services and intellectual property by providing a framework for negotiating trade agreements. As a result, FTAs started proliferating on the strong principles of bilateralism and multilateralism. This not only guided trade negotiations, but also made FTAs complex, particularly their conclusion and effective utilisation. For there needed to be a mechanism which could track the changes in tariff headings resulting from value addition on inputs, a system of rules to calculate the extent of value addition in regions concerned and a set of criteria to determine if the goods so converted could be considered as originating from that particular country to be eligible for an import or export consignment under FTA.
Apart from various economic, political and legal challenges, several surveys clearly bring out lack of information as the biggest obstacle in utilising FTAs. There are other challenges like low margins of preference, complications in interpreting Rules of Origin (ROOs), non-tariff measures (NTMs) inhibiting exports, other exemption schemes easier to use than FTAs, etc. However, at over 35 percent, lack of information tops the list of challenges.
Evidently, therefore, the considerable under-utilisation of FTAs despite their high utility value is attributable to the inability to access, manage and process the immense amount of information that is integral to it. Manual control on any of these activities is simply out of question. Tracking of developments on FTAs being negotiated or signed by governments, analyses of the different articles therein and important information about inclusion and exclusion of tariff lines with their HS (Harmonised System) classification codes, changes in tariff classification, Most Favoured Nation (MFN) duty rates, interpretation of the Rules of Origin (ROOs), actual duty exemptions or concessions, safeguard measures, procedure and authorised agencies for obtaining Certificate of Origin, Mutual Recognition Agreements (MRA) and non-tariff measures (NTMs) namely, customs, licensing and inspection procedures, documentation and comparative analysis of tariff concessions by different FTAs, and so on, is quite crucial to effectively utilising them.
And the furious proliferation of these FTAs only exasperates the pressing need for organisations to have an advanced information management system as the only way to store and process all this information. More specialised this system is in its design and more integrated it is with the other participating systems in the supply chain trading partner ecosystem including the government agencies, more effectively would it help organisationsutilise the various FTAs applicable to their business geographies. For all the cost advantages and the business benefits that FTAs are intended to bring in, this investment, which comprehensively covers automation, documentation, integration and compliance, is most likely to pay back large dividends.
References:
- Frequently Asked Question (FAQ) Free Trade Agreements: Indian Trade Portal
- Free Trade Agreements – A brief history: European Student Think Tank, Sep 2016
- International Trade Agreements: Ministry of Commerce and Industry, Dept. of Commerce, Govt. of India
- What is an FTA and what are the benefits: Article by Matthew Grimson, ABC News, Apr 2014
- Asian FTAs: Trends, Prospects, and Challenges: ADB Economics Working Paper Series, Oct 2010
- Thomson Reuters-KPMG International Annual Global Trade Report 2017
Margin of preference: It means the percentage difference between the Most-Favoured-Nation (MFN) rate of duty and the preferential rate of duty for the like product, and not the absolute difference between those rates. Margin of preference = (MFN duty– tariff rate conceded under the Agreement) × 100(per cent).
(Source: http://www.forbesindia.com/blog/economy-policy/utilising-free-trade-agreements-for-what-they-mean-to-business/ dated 2nd May-2018)
|
|
BACK |
India tops list of fastest growing economies for coming decade: Harvard study
|
NEW YORK: India tops the list of the fastest growing economies in the world for the coming decade and is projected to grow at 7.9 per cent annually, ahead of China and the US, according to a Harvard University report.
The Centre for International Development (CID) at Harvard University said in new growth projections yesterday that countries that have diversified their economies into more complex sectors, like India and Vietnam, are those that will grow the fastest in the coming decade.
The researchers also find India ranks the best on the criteria termed the Complexity Opportunity Index (COI), which measures how easy it is to redeploy existing knowhow to enter new complex products.
"India's existing capabilities have not only diversified its exports, but also allow for easy redeployment into related products that depend on those capabilities, making further diversification relatively easy," it said.
China is projected to grow at 4.9 per cent annually to 2026, the US three per cent and France 3.5 per cent.
The top ranking in COI means India has many "unrealised opportunities" to diversify into related, high-value sectors to continue to drive productivity growth and job creation.
"Up to now, that potential remains unrealized, however, as India's complexity has not changed over the past decade. The rapid growth that is predicted is effectively capitalizing on previous gains in complexity," the report added.
It stressed that ensuring the long-run potential of India's economic growth will rely on realizing diversification into related products. The other major challenge will be to ensure the inclusive nature of this productive transformation, as the gains made in new chemical, vehicle and electronics exports are highly concentrated in specific localities of the subcontinent.
"Whether that knowhow can be disseminated into new areas of India will in part determine whether rapid growth can be sustained in the long-term," it said.
Director of CID, professor at Harvard Kennedy School (HKS) and the leading researcher of The Atlas of Economic Complexity, Ricardo Hausmann said that Southeast Asia continues to dominate the global growth landscape, driven by the diversification of economies into complex manufacturing, but the leading countries have shifted within the region, with the Philippines, Vietnam, Indonesia, and Thailand poised to lead growth in the coming decade.
The researchers further point out that many low-income countries, including Bangladesh, Venezuela, and Angola have failed to diversify their knowhow and face low growth prospects.
"Others like India, Turkey, and the Philippines have successfully added productive capabilities to enter new sectors and will drive growth over the coming decade," said Sebastian Bustos, a lead CID researcher in trade and economic complexity methods.
(Source: https://economictimes.indiatimes.com/news/economy/indicators/indias-7-projected-growth-rate-amazingly-fast-adb/articleshow/64049171.cms dated 4th May-2018)
|
|
BACK |
View: India must tread carefully on free trade agreements
|
By VK Saraswat, Prachi Priya & Aniruddha Ghosh
Trade theory has consistently been a strong proponent of free trade of goods, services, capital and labour. However, a growing wave of protectionism has dominated global trade of late. While it is difficult to assess whether this will lead to a significant shift in the global trade paradigm, a review of India’s existing free trade agreements (FTAs) before negotiating new ones is necessary.
India is a fairly open economy with overall trade (exports plus imports) as a percentage of GDP at around 40%. Its exports have diversified both in terms of markets and products in the past two decades. Indian exports have gradually found their way into new markets and the export sector has moved up the value chain, leading the way with high-value products like industrial machinery, automobiles and car parts, and refined petroleum products.
India’s exports to FTA countries have not outperformed overall export growth, or exports to rest of the world. Both have grown at a commensurate rate of 13% y-o-y. FTAs have led to increased imports and exports, although this has widened the trade deficit. For example, India’s trade deficit with Asean (Association of Southeast Asian Nations), South Korea and Japan has doubled to $24 billion in FY2017 from $15 billion in FY2011 (with the signing of the respective FTAs) and $5 billion in FY06.
Also, India’s exports are much more responsive to income changes as compared to price changes. So, a tariff reduction or elimination does not boost exports significantly. Utilisation rate of regional trade agreements (RTAs) by exporters in India is very low. Most estimates put it at less than 25%. Lack of information on FTAs, low margins of preference, delays and administrative costs associated with rules of origin, non-tariff measures, are major reasons for under-utilisation.
When it comes to the India-Asean FTA, there is a deterioration of the quality of trade. Apart from the surge in total trade deficit due to tariff cuts, sectorwise trade flows also paint a grim picture. As per the UN’s Harmonised System of Product Classification, products can be grouped into 99 chapters, and further into 21sections like textiles, chemicals, vegetable products, etc. India has experienced a worsening of trade balance (deficit increased or surplus reduced) for 13 out of 21 sectors.
This also includes value-added sectors like chemicals and allied, plastics and rubber, minerals, leather, textiles, gems and jewellery. Sectors where trade balance has improved include animal products, cement and ceramic, arms and ammunitions. Sectors where trade deficit has worsened account for approximately 75% of India’s exports to Asean.
So, there are genuine concerns of trade asymmetry when India signs up new FTAs because of past FTA experience. However, FTAs are instrumental in creating seamless trade blocs that can aid trade and economic growth. Here are some suggestions while going forward with future FTA negotiations.
Before getting into any multilateral trade deal, India should review its existing FTAs in terms of benefits to various stakeholders like industry and consumers, trade complementarities and changing trade patterns in the past decade. Negotiating bilateral FTAs with countries where trade complementarities and margin of preference is high may benefit India in the long run.
Also, higher compliance costs nullify the benefits of margin of preference. Thus reducing compliance cost and administrative delays is extremely critical to increase utilisation rate of FTAs. Proper safety and quality standards should be set to avoid dumping of lower quality hazardous goods into the Indian market.
Circumvention of rules of origin should be strictly dealt with by the authorities. Well-balanced FTA deals addressing the concerns of all the stakeholders is the need of the hour.
(Source: https://economictimes.indiatimes.com/news/economy/foreign-trade/view-india-must-tread-carefully-on-free-trade-agreements/articleshow/64055496.cms dated 7th May-2018)
|
|
BACK |
Specialty chemical sector may double market size by FY25: Report
|
The specialty chemicals sector registered double-digit growth over FY13-FY17, supported by subdued oil prices and strong domestic and export demand.
The domestic specialty chemical sector is expected to grow by about 10 per cent annually to almost double the market size by FY25, driven by growth in end-user industries, a report said.
"The Indian chemicals sector is a market worth about USD 160 billion, with specialty chemicals representing about 20 per cent of the value. We expect the specialty chemical sector to grow by about 10 per cent annually to almost double the market size by FY25," India Ratings report on 'FY19 Outlook: Specialty Chemicals' said here.
The specialty chemicals sector registered double-digit growth over FY13-FY17, supported by subdued oil prices and strong domestic and export demand.
Ind-Ra expects FY19 to be a strong year for the domestic specialty chemicals sector on anticipation of a continued increase in demand from end-user industries and tight global supply due to stringent environmental norms in China.
Specialty chemical end-use industries such as textile, automotive, personal care, construction chemicals and agrochemicals, as w ell as application-driven segments such as surfactants, paints, coatings and colorants, to experience high growth in the medium-term.
The governments focus on affordable housing, agriculture and increased expenditure on infrastructure development will further spur demand for performance-enhancing chemicals. Ind-Ra expects strong growth across the key segments of specialty chemicals.
However, per capita chemical consumption in the country remains low compared with that in developed countries and emerging economies such as China, indicating latent demand potential in the Indian market, the report said.
The implementation of strict environmental norms in China has reduced the competitive advantages for Chinese firms, especially inefficient smaller firms that became unviable.
In 2017, an estimated 40 per cent of the chemical manufacturing capacity in China was temporarily shut down for safety inspections, with over 80,000 manufacturing units charged and fined for breaching permissible emission limits.
Ind-Ra expects the supply of major chemicals from China to remain subdued in FY19, favourably impacting volume and pricing for Indian exporters.
Higher-than-expected growth in demand, along with stable feedstock availability at low prices and ability to comply with regulatory norms, may further strengthen operating profile of the sector, according to Ind-Ra.
However, the agency believes that sharp changes in oil prices due to an unfavourable macroeconomic scenario, uncertainty about feedstock procurement and an uptick in global capacity expansion may have a negative impact on the sector.
(Source:-https://auto.economictimes.indiatimes.com/news/industry/specialty-chemical-sector-may-double-market-size-by-fy25-report/64072614 dated 8th May-2018)
|
|
BACK |
Suresh Prabhu asks officials from different Ministries to prepare action plan within next fortnight on boosting exports
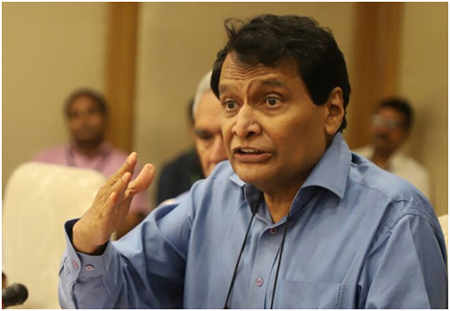 |
| |
New Delhi, May 9 (KNN) Commerce & Industry Minister Suresh Prabhu has asked secretaries and senior officers from different Ministries and Departments to prepare an action plan with short term targets on boosting exports and send it to his ministry within the next fortnight.
Prabhu, on Tuesday, addressed secretaries and senior officers in the first inter-ministerial meeting on Sectoral Export Promotion Strategy.
The meeting was attended by Secretaries to Government of India from Department of Commerce, DIPP, Electronics and IT, Animal Husbandry and Dairying and MSME, besides senior officers from about 14 other administrative Ministries/Departments including Agriculture, Textiles, Petroleum, Food Processing Industries, Pharma, Chemical and Petrochemical, Defence production and MEA which are concerned with various product groups which comprise a substantial part of India’s merchandise exports.
Commerce Minister asked all officers to prepare an action plan on boosting exports of products being handled by their respective Ministries and send it to the Department of Commerce within the next fortnight.
He stressed that the action plan should also have short term targets which are achievable in the next two months and the Department of Commerce will take the assistance of Ministry of External Affairs to implement the action plans through its commercial missions abroad.
Minister informed that the Union Cabinet has accorded approval of Rs. 5000 crores to promote export of services in champion sectors and the Department of Commerce (DoC) is organizing the next Global Exhibition on export of Services at Mumbai on 15th May 2018.
He told the respective Ministries and Departments that DoC as well as the ITPO can organize road-shows and exhibitions for their sectors and products.
Minister stated that a holistic approach to manufacturing and exports is the need of the hour as protectionist approach may actually have a negative impact on value added items of export. We need to push the idea of looking for new markets as well as exporting new products.
Ministries should work out the strategy, and after receiving the plans, DoC will organize further meetings with export promotion councils, trading houses as well as major exporters. A ‘Best Exporting Ministry/Dept. Award’ will also be announced.
The Minister advised the EXIM bank to prepare an action plan to alleviate the financial difficulties being faced by exporters. Similarly the FPI sector can take the help of NABARD for financing their projects. The Minister announced that the arrangement for having inter-ministerial meetings to boost exports with concerned administrative ministries will be institutionalized by DoC.
Minister of State, Commerce & Industry, CR Chaudhary invited attention to stagnating exports in gem and jewellery, textiles and leather sectors and exhorted the Departments to come up with new proposals to boost exports in these areas.
Commerce Secretary, Rita Teaotia informed the officers that while there has been a 10% growth in merchandise exports in the current year, our share in global trade is static at 1.7% in merchandise exports and 3.4% is services exports. We need to look at new markets. While we have done well in US and Europe there has not been adequate focus on fast emerging markets in Asia. We need to focus more on exports to China, Latin America and Africa.
DGFT AlokChaturvedi observed that India’s share of exports is high in goods which are less traded and low in goods that are traded more in the world. This needs to be realigned.
DG highlighted the sectors where the export share of the sector in India’s exports is less compared to the share of the sector in world exports. These were identified as potential sectors.
(Source: http://knnindia.co.in/news/newsdetails/sectors/suresh-prabhu-asks-officials-from-different-ministries-to-prepare-action-plan-within-next-fortnight-on-boosting-exports dated 9th May-2018)
|
|
BACK |
Dangerous Goods:-Classification of Corrosive Substances – Class 8
 |
During transport corrosive substances pose health hazard, physical hazard or combination of both. Primary safety concern is of course health hazard however, leakage of corrosive substances may materially damage the cargo transport unit or the vessel itself and when in contact with other cargo they may cause dangerous reactions resulting in explosion and fire. |
What are corrosive substances?
Any solid or liquid which will cause severe damage when in contact with living tissue or will materially damage or destroy other goods or means of transport are corrosive substances of Class 8. |
 |
Properties of corrosive substances
There are varying properties for different corrosive substances which may cause severe health or physical hazard.
If a substance poses severe personal damage then IMDG Code in column 17 of dangerous goods list will state “causes (severe) burns to skin, eyes and mucous membranes”.
If IMDG Code states “corrosive to most metals” it means that any metal likely to be present in a ship, or in its cargo, may be attacked by the substance or its vapour.
“Corrosive to aluminium, zinc, and tin” implies that iron or steel is not damaged in contact with the substance.
Some of these substances can corrode glass, earthenware and other siliceous materials. Many corrosives substances only become corrosive after having reacted with water, or with moisture in the air.
How are the health hazards determined for corrosive substances?
Corrosive substances are divided into three packing groups according to their degree of hazard.
- Packing group I: Very dangerous substances and preparations;
- Packing group II: Substances and preparations presenting medium danger;
- Packing group III: Substances and preparations presenting minor danger.
For named substances the variations in danger levels through packing groups assigned in dangerous goods list of IMDG Code are based on the destructive properties on living tissue through experience, inhalation risk and reactivity with water.
For new substances and mixtures assignment of packing group must be based on length of time of contact required to cause full thickness destruction of human skin.
Below table summarizes this criterion
Packing group |
Exposure time |
Observation period |
Effect |
I |
≤ 3 min |
≤ 60 min |
Full thickness destruction of intact skin |
II |
˃ 3 min ≤ 1 h |
≤ 14 days |
Full thickness destruction of intact skin |
III |
˃ 1 h ≤ 4 h |
≤ 14 days |
Full thickness destruction of intact skin |
Assignment of packing group on basis of above table must take account of human experience in instances of accidental exposure and in absence of human experience assignment of packing group must be as per data obtained by experiments in accordance with below standards
- OECD Guideline for the testing of chemicals No. 404, Acute Dermal Irritation/Corrosion, 2002.
- OECD Guideline for the testing of chemicals No. 435, In Vitro Membrane Barrier Test Method for Skin Corrosion, 2006.
- OECD Guideline for the testing of chemicals No. 430, In Vitro Skin Corrosion: Transcutaneous Electrical Resistance Test (TER), 2004.
- OECD Guideline for the testing of chemicals No. 431, In Vitro Skin Corrosion: Human Skin Model Test, 2004.
A substance which is determined not to be corrosive in accordance with OECD Test Guideline 430 or 431 may be considered not to be corrosive to skin for the purposes of IMDG Code without further testing.
How are the physical hazards determined for corrosive substances?
Any substance which is judged not to cause full thickness destruction of intact skin tissue but which exhibit a corrosion rate on either steel or aluminium surfaces exceeding 6.25 mm a year at a test temperature of 55°C when tested on both materials is considered as corrosive and be assigned to packing group III. Method of testing is prescribed in the Manual of Tests and Criteria, part III, section 37.
Emergency Response on board ships for incidents involving Corrosive Substances
Corrosive substances are extremely dangerous to humans, and many may cause destruction of safety equipment. Burning cargo of class 8 will produce highly corrosive vapours. Consequently, wearing self-contained breathing apparatus is essential. Corrosive solids and liquids can permanently damage human tissue. Some substances may corrode steel and destroy other materials (e.g. personal protection equipment). Corrosive vapours are highly toxic, often lethal by destroying lung tissue. All corrosive chemicals will be dangerous to human health (toxic). Avoid direct contact with the skin, protect against inhalation of vapours or mists.
The use of self-contained breathing apparatus and appropriate chemical protection (e.g. chemical suit) is recommended in all cases. Washing spillages and forcing vapours overboard with water-spray is the method in all cases. It is important to shut off, close and secure all ventilation leading into the accommodation of choice, machinery spaces and the bridge. All personnel should stay away from effluent (see SPILLAGE SCHEDULE S-B in Emergency Response Procedures for Ships Carrying Dangerous Goods (EmS Guide) published in the supplement of IMDG Code).
Some corrosive substances are also flammable. In these cases, the safety advice for both flammable and corrosive substances should be followed. Use of copious quantities of water and water-spray is recommended. In general, the flammability hazard is more important than the corrosive properties for the safety of the ship and the crew (see e.g. SPILLAGE SCHEDULES S-C and S-G in Emergency Response Procedures for Ships Carrying Dangerous Goods (EmS Guide) published in the supplement of IMDG Code).
|
|
BACK |
EXPORT STRATEGY- SOUTH AFRCIA
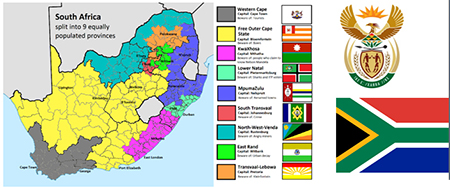 |
BRIEF OF COUNTRY SOUTH AFRCIA
South Africa the Republic of South Africa is called the ‘Rainbow Nation’. This is because of its multicultural diversity, after different groups came here in previous centuries. The country's more recent history of apartheid is better known. Now people can live anywhere if they have the right opportunities, such as a good education. Total Population of South Africa is 50.5 million (UN, 2011 estimate). Capital Pretoria (executive), Bloemfontein (judicial), Cape Town (legislative).
Geographical area is 1.219,089 sq km (470,693 sq miles), 11 official languages - Afrikaans, English, Ndebele, Pedi, Sotho, Swati/Swazi, Tsonga, Tswana, Venda, Xhosa and Zulu. Main religions: Christianity, Islam, Hinduism.
Dutch traders landed at the southern tip of modern day South Africa in 1652 and established a stopover point on the spice route between the Netherlands and the Far East, founding the city of Cape Town. After the British seized the Cape of Good Hope area in 1806, many of the Dutch settlers (Afrikaners, called "Boers" (farmers) by the British) trekked north to found their own republics, Transvaal and Orange Free State. The discovery of diamonds (1867) and gold (1886) spurred wealth and immigration and intensified the subjugation of the native inhabitants. The Afrikaners resisted British encroachments but were defeated in the Second South African War (1899-1902); however, the British and the Afrikaners, ruled together beginning in 1910 under the Union of South Africa, which became a republic in 1961 after a whites-only referendum. In 1948, the Afrikaner-dominated National Party was voted into power and instituted a policy of apartheid - the separate development of the races - which favored the white minority at the expense of the black majority. The African National Congress (ANC) led the opposition to apartheid and many top ANC leaders, such as Nelson MANDELA, spent decades in South Africa's prisons. Internal protests and insurgency, as well as boycotts by some Western nations and institutions, led to the regime's eventual willingness to negotiate a peaceful transition to majority rule.
The first multi-racial elections in 1994 following the end of apartheid ushered in majority rule under an ANC-led government. South Africa has since struggled to address apartheid-era imbalances in decent housing, education, and health care. ANC infighting came to a head in 2008 when President Thabo MBEKI was recalled by Parliament, and Deputy President Kgalema MOTLANTHE, succeeded him as interim president. Jacob ZUMA became president after the ANC won general elections in 2009; he was reelected in 2014. His government has been plagued by numerous scandals, leading to gains by opposition parties at the municipal level in 2016.
ECONOMY OF SOUTH AFRCIA
South Africa is a middle-income emerging market with an abundant supply of natural resources; well-developed financial, legal, communications, energy, and transport sectors; and a stock exchange that is Africa’s largest and among the top 20 in the world.
Economic growth has decelerated in recent years, slowing to an estimated 0.7% in 2017. Unemployment, poverty, and inequality - among the highest in the world - remain a challenge. Official unemployment is roughly 27% of the workforce, and runs significantly higher among black youth. Even though the country's modern infrastructure supports a relatively efficient distribution of goods to major urban centers throughout the region, unstable electricity supplies retard growth. Eskom, the state-run power company, is building three new power stations and is installing new power demand management programs to improve power grid reliability but has been plagued with accusations of mismanagement and corruption and faces an increasingly high debt burden.
South Africa's economic policy has focused on controlling inflation while empowering a broader economic base; however, the country faces structural constraints that also limit economic growth, such as skills shortages, declining global competitiveness, and frequent work stoppages due to strike action. The government faces growing pressure from urban constituencies to improve the delivery of basic services to low-income areas, to increase job growth, and to provide university level-education at affordable prices. Political infighting among South Africa’s ruling party and the volatility of the rand risks economic growth. International investors are concerned about the country’s long-term economic stability; in late 2016, most major international credit ratings agencies downgraded South Africa’s international debt to junk bond status.
CHEMICAL INDUSTRY IN SOUTH AFRCIA:
Chemistry is the science of matter, its structure, composition, properties and interactions of substances. It draws on the language of mathematics and the laws of physics to describe the world around us. It is this science that forms the basis of the chemical industry, making it highly technical. Due to the hazardous nature of the chemical industry, all spheres of Government have strict regulations on consumer and environmental protection, occupational health, chemical processes, transport and management of chemicals.
The South African chemical sector is of considerable economic significance to the country, with the export and import values of industry products amounting to approximately R41 billion and R75 billion respectively in 2012 (Quantec Research (Pty) Ltd, www.quantec.co.za). This equates to a trade deficit of about R34 billion. It contributed 25% to the manufacturing sector and 4% to GDP (Quantec, 2012) and impacts on the development of other industrial sectors such as agriculture, healthcare, clothing and textile. The chemical sector employment figures (formal and informal) for 2012 were 145684 (Quantec, 2012). According to the Chemical Industries Education and Training Authority (CHIETA) Workplace Skills Plan (WSP) submissions, June 2012 employment figures in the chemical sector were as follows: petroleum 44 371; base chemicals 22 466; specialty chemicals 15 381; surface coatings 8 261; fertilizers 5 651; and explosives 5 287.
The Department of Trade and Industry (the dti) has classified the sector into 11 sub-sectors, namely: liquid fuels; commodity inorganic chemicals; commodity organic chemicals; fine chemicals; pure functional and speciality chemicals; bulk formulated chemicals; pharmaceuticals; consumer formulated chemicals; rubber products; plastics products; and primary polymers and rubbers. This is the most appropriate classification of the sector in terms of strategic and business perspectives. The Standard Industrial Classification (SIC), which is generally used for statistical reporting, is not user friendly in providing information for chemical sector development. Pharmaceuticals, Plastics and Cosmetics are standalone directorates within the dti to better focus on the ARVs, higher numbers of people employed per capital expenditure and diverse yet interrelated numbers of business lines respectively. The chemicals sector desk therefore excludes these standalone directorates.
The chemical industry can be classified into two broad categories, i.e. upstream and downstream. Upstream is generally technology intensive in the manufacture of basic chemicals as raw materials/feedstock, while downstream turns these raw materials into intermediate and final products. The capital-intensive operations of the upstream chemical sector tend to be automated to ensure that products meet the required quality and specification consistency. The upstream sector is not well structured to accommodate either high numbers of employment or the development of Small or Micro Enterprises (SMEs).
The downstream chemical sector has operations that are typically labour intensive and consists of formulation production processes. It has greater potential to contribute significantly to large numbers of employment and the development of SMEs. It is within the downstream sector that the incubator programme of Government can have a positive impact in creating vibrant SMEs.
(Source:http://www.thedti.gov.za/industrial_development/sec_chemicals.jsp)
POTENTIAL STRATEGIC OPPORTUNITIES
South Africa exports most of its fluorspar mineral resource in an unbeneficiated form. This is contrary to Government policy to beneficiate the country's abundant natural resources. Beneficiation adds more value to domestic mineral resources ahead of export to provide the country with greater economic value and increased numbers of people employed. This is necessary for industrialisation, inclusive growth and poverty alleviation.
thedti has commissioned market research on potential opportunities in downstream fluorochemicals, with an aim of establishing a globally competitive fluorspar beneficiation industrial cluster in South Africa. This is to take advantage of South Africa's largest single fluorspar reserves globally and to manufacture fluorochemicals that are critical in the production of agrochemicals, pharmaceuticals, semi-conductors for the electronics industry as well as domestic and industrial refrigeration and air-conditioning.
The possibility of shale gas exploration and exploitation in the Karoo provides South Africa with a possible game changer. Although the potential extent of the Karoo shale gas reserves are not yet known, the chemical industry may be one of the huge beneficiaries, considering that two South African companies, Sasol and PetroSA, operate world-scale facilities to produce liquid fuels, chemicals and electricity from natural gas.
If shale gas is proven to be commercially viable, urea is one chemical that has the potential to immediately attract investment in manufacturing facilities in South Africa. Currently, urea is not manufactured in the country, but is imported by big players in the fertiliser industry due to huge import barriers including the smallest viable shipload requirement (with urea being a scarce product globally and supply being dependent on the availability of ships).
SOUTH AFRICAN CHEMICALS INDUSTRY HAS GROWTH POTENTIAL
The South African chemicals industry contributes 5% to the country’s gross domestic product (GDP), while the local petrochemicals sector is the largest sector contributor to the chemicals industry in South Africa, with a contribution of 55%.
However, analyst notes that the South African chemicals industry is expected to have moderate growth of between 3% and 4% over the next five years, through innovation and increased operation efficiency, making the chemicals industry more competitive and attractive.
“Petrochemicals growth will be driven by the demand from end-users, such as the paints and coatings, automotive, mining and construction sectors, where large amounts of chemicals are still procured locally, as the local refinery capacities meet the bulk of local demand.
“The market for petrochemicals is expected to grow at a compound yearly growth rate of close to 2%, owing to limited investment in local refineries and old technology limiting efficiency,” Analyst asserts.
She notes that the greatest potential for growth in the chemicals industry lies in the plastics sector, with moderately high growth expected, amidst the slow GDP growth and market maturity.
Also, the demand for additives used in fuels is expected to increase as the local Clean Fuels II regulation, which aims to lower the sulphur content of fuels, is expected to come into effect in 2017. In addition, the biofuels-based legislation for fuels, to be implemented in 2015, will impact on this demand. This legislation requires all diesels produced to have a 5% blend of biodiesel, and ethanol to have a bioethanol blend of between 2% and 10%.
Meanwhile, Analyst points out that the local chemicals market is becoming increasingly competitive, owing to intensified regulations on emissions and waste, which puts chemicals manufacturers and end-users under pressure.
“The biggest challenges in the South African chemicals market are the large volumes of raw chemical materials that continue to be imported and are subject to exchange rate fluctuations. “Delays at ports when importing chemicals, and strikes, add to the costs of chemicals, which are, in most cases, absorbed by the manufacturer to remain competitive, resulting in lower profit margins,” she asserts.
Analyst adds that another challenge is the outdated technology and processes used to refine and produce chemicals in South Africa. As a result, the chemical products manufactured are not competitive, compared with similar international goods, lowering demand for locally produced chemicals.
“Upgrading technologies requires high capital investments, which are not easily accessible in South Africa, owing to product cost implications. However, more investment could potentially result in more efficient production processes and lower operating costs,” Analyst says.
Currently, there are limited research and development activities in the local chemicals industry. She explains that technological advances are primarily driven by multinational corporations as they want to maintain their global brand image and standards, which results in these corporations adopting foreign technologies, thereby advancing the local chemicals manufacturing sector.
“The local chemicals industry offers major input materials, such as solvents and polymers, to the manufacturing sector,” Analyst outlines.
There has, however, been slow growth over the past two years and the sector is expected to continue being a slow-growth market for the chemicals industry,” she posits.
Analyst suggests that government’s emphasis on the local development of pharmaceuticals will help drive advocacy for local input materials, such as excipients and active pharmaceutical ingredients, through tenders.
“The agricultural chemicals sector is also expected to register significant growth, though future regulations could potentially slow down the increase in the supply of crop-protection chemicals,” Analyst concludes
(Source:http://www.engineeringnews.co.za/article/south-african-chemicals-industry-has-growth-potential-2014-03-21 )
MARKET CHALLENGES-SOUTH AFRICA
- There is serious, growing concern about a host of political, economic and regulatory factors that affect foreign businesses adversely. These include increasingly persistent reports about corruption and ineptitude in high government circles, significant unemployment, violent crime, insufficient infrastructure and poor government service delivery to impoverished communities. The increasingly rhetorical political debate over the direction of economic policy has been exacerbated by very low economic growth and a governing party reeling from setbacks in local government elections in August 2016.
- Overseas firm entering this market must contend with a mature and competitive market marked by well-established European and Asian competition. A trade agreement with the European Union enables many European products to enter South Africa duty-free or at lower rates.
- The volatile rand-dollar exchange rate can complicate planning especially for smaller or new-to-market firms. Although forward cover is readily available, and the rand is one of the most heavily traded currencies in the world, the cost does reflect interest rates, which tend to be higher than in United States and developed markets because of South Africa’s relatively higher historical rates of inflation.
- Broad-Based Black Economic Empowerment (B-BBEE) policies aim at redressing economic imbalances among historically disadvantaged communities to facilitate socio-economic transformation, specifically to increase the number of black South Africans that either own or manage companies. B-BBEE requirements demand due consideration by all firms planning to do business with the South African Government, but also within the general business community. New, more ambitious ascriptive requirements were introduced in 2013 and continue to be tightened up in order to induce improved economic opportunities by awarding more points in the equity/ownership requirement than previously. As in the past, entities gain credits if they include in their upstream and downstream supply chain partnering with other entities that qualify as being compliant on employment equity and other criteria. B-BBEE fronting that creates the appearance of regulatory compliance is a criminal offense and may lead to a fine of up to 10% of an entity’s turnover or up to 10 years’ incarceration by directors and complicit staff. A few foreign companies have addressed the ownership element of B-BBEE by implementing “equity equivalent” programs that emphasize training and development of local companies, although it can be difficult to get government approval for these proposals. Also see Selling to the Government below.
- For new-to-market overseas exporters, these ascriptive trading requirements have encouraged low-exposure market entry modes by teaming up with qualified local importer-resellers and service providers who act as the prime contractor to the South African Government and large economic players. The South African Government is continuously changing the mandatory industrial localization requirement for foreign suppliers that often view this as a cost and risk factor for doing business in South Africa.
- Since 2012, the South African government has announced plans to tighten labor and foreign ownership laws and mandated industrial localization. Sectors of specific concern have included the extractive industries, security services and agriculture. It remains uncertain in which direction government will go to address rigidities in labor regulations in the face of popular discontent around unemployment, poverty and inequality.
- Despite current uncertainties, as the most advanced, broad-based economy on the continent, South Africa still offers exporters and investors a diverse and mature economy with vibrant financial and other service sectors, as well as preferential access to export markets in the United States, the European Union and the Southern African Development Community (SADC).
- Commercial standards are generally similar to those in most developed economies, overseas investors find local courts fair and consistent, and institutions are well-developed. Similarly, democratic life is well-established with transparent and contested elections, an appreciation for the rule of law, and citizens maintaining significant pride in the constitution and the peaceful formation of the post-Apartheid state.
- Despite socio-economic and political uncertainties, South Africa is still a destination largely conducive to overseas investment, and should remain so as the dynamic business community is highly market-oriented and the driver of economic growth. South Africa offers ample opportunities and continues to attract investors seeking a location to access the rest of the African continent.
- Despite increasing unemployment (while the nominal rate is 26%, most observers find the broader definition including those who have given up looking for a job, which is currently 37%), skilled labor can be difficult to find in many, if not most, technical and professional segments, due to the poor state of the public education system. In addition, HIV/AIDS affects approximately one in ten South Africans with unfortunate implications for labor availability, productivity and healthcare costs. Annual labor negotiations have been marked by violence in previous years, although the last two years have been relatively peaceful.
- 2016 saw a 104-year record drought in the central and northeastern part of the country come to an end, but water scarcity will remain a major concern for agriculture, power generation and human consumption. The Western Cape currently has an unrelated significant water crisis that has led to a declaration of emergency that severely limits water supply.
(Source: https://www.export.gov/article?id=South-Africa-market-challenges)
EXPORTING TO SOUTH AFRICA - MARKET OVERVIEW
- South Africa is a country of 55 million people, enjoying relative macroeconomic stability and a largely pro-business environment.
- South Africa is a logical and attractive option for overseas companies seeking to enter the sub-Saharan Africa marketplace. The country covers 1.22 million square kilometers and is the world’s largest producer of platinum, vanadium, chromium and manganese.
- South Africa is the most advanced diversified and productive economy in Africa. However, its actual growth does not match that of other African economies.
- In 2016, its gross domestic product (GDP) grew by 0.5% to an estimated $ 736.3 billion (based on purchasing power parity – ppp, or $350 billion in the more widely used standard GDP definition). The mature nature of the South African economy is reflected in the mix of economic sectors:
a) Primary (including agriculture, fishing and mining): 10%.
b) Secondary (manufacturing, construction and utilities): 21%.
c) Tertiary (trade, transport and services): 69%.
- The tourism sector has experienced above global average growth, capitalizing on South Africa's natural beauty, wildlife reserves and good infrastructure. The sector is a major foreign exchange earner, along with minerals, agricultural products and some niche, high-tech sectors.
- The country's urban areas boast well-developed infrastructure, comparable to OECD standards. Its growing service sector is a major employer, and the private, corporate side of the economy is well-managed, although facing slow productivity gains. The banking and financial services sector is stable and weathered the 2008 financial crisis well. The Johannesburg Stock Exchange (JSE) ranks among the top emerging market exchanges in the world.
South Africa is well integrated into the regional economic infrastructure as formalized by membership in the Southern African Development Community (SADC). In addition, the Southern African Customs Union (SACU) agreement with Botswana, Namibia, Lesotho and Swaziland facilitates commercial exchanges. South Africa is a member of the World Trade Organization (WTO), the G20, and BRICS (Brazil, Russia, India, China and South Africa).
The African Growth and Opportunity Act (AGOA), renewed for a final 10-year period in 2016, provides duty-free access to the U.S. market for most sub-Saharan African countries, including South Africa. The United States and South Africa signed a new Trade and Investment Framework Agreement (TIFA) in 2012. The United States and SACU concluded a Trade, Investment and Development Cooperation Agreement (TIDCA) in 2008.
Five reasons why overseas companies should consider exporting to South Africa:
1) South Africa remains a must-consider country in sub-Saharan Africa when new-to-market (NTM) companies consider location options; the logistics infrastructure, English language and benign legal processes make this a low entry-threshold country.
2) The business management environment (legal, publicity, marketing, accounting, forensics, process outsourcing, etc.) is arguably the best in Africa.
3) South Africa is a business incubator for NTM ideas; as the middle class in Africa grows, business models launched in and from South Africa will find easier acceptance in other sub-Saharan Africa markets.
4) The penetration of South African companies and agencies into Africa makes finding the right partner to collaborate with in third markets a low-risk business development model.
5) South African companies are receptive to various partnering arrangements with overseas companies; these range from agency, to licensing, to JV’s, to mergers and acquisitions.
(Source: https://www.export.gov/article?id=South-Africa-Market-Overview)
SOUTH AFRICA - MARKET OPPORTUNITIES
Several factors benefit overseas exports:
- Sophisticated financial services, legal and business services sectors;
- Transportation infrastructure;
- South Africa’s position as an entryway to other countries and markets in sub-Saharan Africa;
- The strong reputation enjoyed by overseas branded goods and
- A few, centralized South African government-owned / sponsored capital expenditure programs with partly secured funding.
In general, the best prospects for exports are in capital goods, though opportunities exist in a wide range of consumer products, services and franchising. Due to cyclical, structural and regulatory / policy challenges in the economy, Government capital and operational expenditure is expected to decrease further in 2016 – 2018, and the triple deficit (trade, budget and households) does not bode well for the immediate future.
Of particular note are:
- Electricity Power Systems and Renewable Energy;
- Oil and gas supplies and equipment;
- Transportation Infrastructure;
- Pollution Control Equipment;
- Medical Equipment and Healthcare Services;
- Telecommunications; and
- Inforation Technology.
(Source: https://www.export.gov/article?id=South-Africa-market-opportunities)
SOUTH AFRCIA’s FTA INVOLVEMENT
Summary of Main Trade Agreements between South Africa and the rest of the World
|
Type of Agreement |
Countries Involved |
Main Objective/Terms |
Products Involved |
| Customs Union |
| Southern African Customs Union (SACU) |
Customs Union |
South Africa, Botswana, Lesotho, Namibia and Swaziland |
Duty free movement of goods with a common external tariff on goods entering any of the countries from outside the SACU |
All products |
|
| Free Trade Agreements (FTAs) |
| Southern African Development Community (SADC) FTA |
Free Trade Agreement |
Between 12 SADC Member States |
A FTA, with 85% duty-free trade achieved in 2008. The 15% of trade, constituting the "sensitive list", is expected to be liberalised from 2009 to 2012 when SADC attains the status of a fully-fledged FTA with almost all tariff lines traded duty free. |
Most products |
| Trade, Development and Cooperation Agreement (TDCA) |
Free Trade Agreement |
South Africa and the European Union (EU) |
The EU offered to liberalise 95% of its duties on South African originating products by 2010. In turn, by 2012, South Africa offered to liberalise 86% of its duties on EU originating products. |
There is currently a review of the agreement underway, which is aimed at broadening the scope of product coverage. This is taking place under the auspices of the Economic Partnership Agreement (EPA) negotiations between SADC and the EU |
| EFTA-SACU Free Trade Agreement (FTA) |
Free Trade Agreement |
SACU and the European Free Trade Association (EFTA) -Iceland, Liechtenstein, Norway and Switzerland |
Tariff reductions on selected goods |
Industrial goods (including fish and other marine products) and processed agricultural products. Basic agricultural products are covered by bilateral agreements with individual EFTA States |
| Economic Partnership Agreement between the SADC EPA States, of the one part, and the European Union and its Member States, of the other Part |
Economic Partnership Agreement |
South Africa, Botswana, Namibia, Swaziland, Lesotho and Mozambique (referred to as the SADC EPA Group) and the European Union (EU) |
SA's core interest has been to harmonise trading regime between SACU and the EU; to secure further market access in agriculture (beyond the SA-EU Trade Development and Cooperation Agreement (TDCA) provisions) and claw back on some policy space lost under the TDCA. |
The agreement covers most products. It will replace the Trade Chapter of the TDCA. New market access accrued better than the TDCA will be implemented after entry into force of the SADC-EU EPA. |
|
| Preferential Trade Agreements (PTAs) |
| SACU-Southern Common Market (Mercosur) PTA |
Preferential Trade Agreement |
SACU and Argentina, Brazil, Paraguay and Uruguay |
Tariff reductions on selected goods. It is not expected to enter into force before some time in 2012 |
About 1,000 product lines on each side of the border |
| Zimbabwe/South Africa bilateral trade agreement |
Bilateral Preferential Trade Agreement |
South Africa and Zimbabwe |
Preferential rates of duty, rebates and quotas on certain goods traded between the two countries |
Selected goods. A most recent version of the agreement was signed in August 1996, which lowers tariffs and quotas on textile imports into South Africa. |
|
| Non-reciprocal Trade Arrangements |
| Generalised System of Preferences (GSP) |
Unilateral preferences granted under the enabling clause of the WTO that are not contractually binding upon the benefactors |
Offered to South Africa as developing country by the EU, Norway, Switzerland, Russia, Turkey, the US, Canada and Japan |
Products from developing countries qualify for preferential market access |
Specified industrial and agricultural products |
| Africa Growth and Opportunity Act (AGOA) |
Unilateral assistance measure |
Granted by the US to 39 Sub-Saharan African (SSA) countries |
Preferential access to the US market through lower tariffs or no tariffs on some products |
Duty free access to the US market under the combined AGOA/GSP programme stands at approximately 7,000 product tariff lines. |
|
| Other Agreements |
| Trade, Investment and Development Cooperation Agreement (TIDCA) |
Cooperative framework agreement |
SACU and US |
Makes provision for the parties to negotiate and sign agreements relating to sanitary and phyto-sanitary measures (SPS), customs cooperation and technical barriers to trade (TBT). It also establishes a forum of engagement of any matters of mutual interest, including capacity-building and trade and investment promotion. |
None |
| Trade and Investment Framework Agreement (TIFA) |
Bilateral agreement |
South Africa and US |
Provides a bilateral forum for the two countries to address issues of interest, including AGOA, TIDCA, trade and investment promotion, non-tariff barriers, SPS, infrastructure and others. |
None |
|
| Current Trade Negotiations |
| SACU-India PTA |
Preferential Trade Agreement |
SACU and India |
Tariff reductions on selected goods |
SACU and India are in the process of exchanging tariff requests |
| SADC-EAC-COMESA Tripartite FTA |
Free Trade Agreement |
26 countries with a combined GDP of US$860 billion and a combined population of approximately 590 million people |
The Tripartite Framework derives its basis from the Lagos Plan of Action and the Abuja Treaty establishing the African Economic Community (AEC), which requires rationalisation of the continent's regional economic communities. The FTA will be negotiated over the next three years, with the possibility of an additional two years for completion. |
The Tripartite initiative comprises three pillars that will be pursued concurrently, in order to ensure an equitable spread of the benefits of regional integration: market integration, infrastructure development and industrial development. The FTA will, as a first phase, cover only trade in goods; services and other trade-related areas will be covered in a second phase. |
(Source: https://www.thedti.gov.za/trade_investment/ited_trade_agreement.jsp )
SOUTH AFRICA - IMPORT REQUIREMENTS AND DOCUMENTATION
South Africa has a complex import process. The South African Revenue Service (SARS) defines approximately 90,000 product tariff codes that are strictly enforced on all imports. New-to-Market overseas exporters are actively encouraged to engage the services of a reputable freight forwarding/customs clearance agent well versed in South African convention.
Customs South Africa (Customs SA), a division of SARS, requires that an importer register with its office and obtain an importer’s code from SARS. This impacts many importers and may cause delays to clearance of goods.
SARS uses a Single Administrative Document (SAD) to facilitate the customs clearance of goods for importers, exporters and cross-border traders. The SAD is a multi-purpose goods declaration form covering imports, exports, cross border and transit movements.
The following is required for shipments to South Africa:
- For customs purposes in South Africa, one negotiable and two non-negotiable copies of the Bill of Lading are required. The Bill of Lading may be made out either "straight" or "to order".
- A Declaration of Origin Form, DA59, is to be used in cases where a rate of duty lower than the general rate is claimed as well as for goods subject to antidumping or countervailing duty. DA59 is a prescribed form with stipulated format, size and content. This form does not require Chamber of Commerce certification. One original signed copy of the form must be attached to the original commercial invoice covering goods, which require such a declaration.
- Four copies and one original Commercial Invoice are required. Suppliers must give, in their invoices, all data necessary for the importer to make a valid entry and for the South African Customs to determine value for duty purposes.
- Invoices from suppliers will not be accepted as satisfying the requirements of the customs regulations unless they state, in addition to any proprietary or trade name of the goods, a full description of their nature and characteristics together with such particulars as are required to assess the import duty and to compile statistics.
- One copy of the insurance certificate is required for sea freight. Follow the importer's and/or insurance company's instructions in other matters.
- Three copies of the Packing List are required. Data contained in this document should agree with that in other documents.
To reduce the likelihood of a dutiable assessment of samples, the shipper must state the following:
“Sample: Of no commercial value / Value for customs purposes is USD xxx.”
Zero-value invoices are not accepted by South African customs authorities; the correct value must be stated of the shipment in question.
Import licenses are required for restricted items. Importers must possess an import permit prior to the date of shipment. Failure to produce a required permit could result in the imposition of penalties. The permit is only valid in respect of the goods of the class and country specified. It is non-transferable and may only be used by the person to whom it was issued. Import permits are valid only for the calendar year in which they are issued.
Import permits required for specific categories of restricted goods are obtainable from the Director of Import and Export Control at the Department of Trade and Industry. These categories have been reduced, but still must be obtained for most used / second-hand items.
Department of Trade and Industry
International Trade Administration Commission (ITAC)
Import Control
Private Bag X753
Pretoria, 0001
Tel: +27 (0)12 394 3590/1; Fax: +27 (0)12 394 0517
(Source:https://www.export.gov/article?id=South-Africa-import-requirements-and-documentation ).
GDP (purchasing power parity): $757.3 billion (2017 est.),$752.1 billion (2016 est.),$750 billion (2015 est.)
Industries: - Mining (world's largest producer of platinum, gold, chromium), automobile assembly, metalworking, machinery, textiles, iron and steel, chemicals, fertilizer, foodstuffs, commercial ship repair.
Exports: - $78.25 billion (2017 est.),$75.16 billion (2016 est.)
Exports Commodities: - Gold, diamonds, platinum, other metals and minerals, machinery and equipment.
Exporting Partners: - China 9.2%, Germany 7.5%, US 7.4%, Botswana 5%, Namibia 4.8%, Japan 4.6%, India 4.3%, UK 4.2% (2016)
Imports: - $80.22 billion (2017 est.),$74.17 billion (2016 est.)
Import Commodities: - Machinery and equipment, chemicals, petroleum products, scientific instruments, foodstuffs.
Import Partners: - China 18.1%, Germany 11.8%, US 6.7%, India 4.2% (2016)
(Source:https://www.cia.gov/library/publications/the-world-factbook/geos/sf.html )
CHEMEXCIL’S COMMODITYWISE EXPORTS TO SOUTH AFRICA
|
|
|
US$ in million |
| Chapter No./Panel |
2014-15 (Actual) |
2015-16 (Actual) |
%over 2014-15 |
2016-17 (Provisional) |
% over 2015-16 |
| (32) Dyes & (29) Dye Intermediates |
22.52 |
20.30 |
-9.86 |
20.74 |
2.17 |
| (28) Inorganic, (29) Organic & (38) Agro chemicals |
82.11 |
92.87 |
13.10 |
119.46 |
28.63 |
| (33) Cosmetics, (34) Soaps, Toiletries and (33) Essential oils |
31.23 |
29.88 |
-4.32 |
37.29 |
24.80 |
| (15) Castor Oil |
4.51 |
3.95 |
-12.42 |
4.09 |
3.54 |
| Total |
140.37 |
147.00 |
4.72 |
181.58 |
23.52 |
| Source:DGCI&S |
|
|
|
|
|
DYES-TOP ITEMS EXPORTS TO SOUTH AFRICA
|
|
|
US$ in Million |
| HSCode |
Product |
2014-2015-Value |
2015-2016-Value |
2016-2017-Value |
| 32050000 |
COLR LAKES |
2.77 |
3.78 |
4.39 |
| 32042010 |
0PTICAL WHITENING AGENTS |
1.81 |
1.72 |
2.06 |
| 32041751 |
PIGMENT BLUE 15 (PATHALOCYANINE BLUE) |
2.06 |
1.93 |
1.99 |
| 32041761 |
PIGMENT GREEN 7 (PATHALOVYANINE GREEN) |
2.30 |
2.01 |
1.76 |
| 32041759 |
OTHERS PIGMENT BLUE |
1.94 |
1.42 |
1.47 |
| 32041218 |
ACID BLACKS(AZO) |
1.12 |
1.43 |
1.20 |
| 32041981 |
FOOD COLOURING YELLOW 3 (SUNSET YELLOW) |
0.89 |
0.89 |
1.06 |
| 32041739 |
OTHERS PIGMENT RED |
0.76 |
0.99 |
0.96 |
| 32041990 |
OTHR INCL MIXR OF COLRNG MATR OF TWO OR MORE OF SUB-HDNG 320411 TO 320419 N.E.S. |
1.33 |
0.80 |
0.94 |
| 32041989 |
OTHER FOOD COLOURING |
1.53 |
1.16 |
0.90 |
| |
Total |
16.51 |
16.13 |
16.73 |
| SOURCE:DGCI&S |
|
|
|
DYE INTERMEDIATES-TOP ITEMS EXPORTS TO SOUTH AFRICA
|
|
|
US$ in Million |
| HSCode |
Product |
2014-2015-Value |
2015-2016-Value |
2016-2017-Value |
| 29173500 |
PHTHALIC ANHYDRIDE |
0.20 |
0.00 |
0.23 |
| 29215190 |
OTHR O-M-P-PHNYLENEDIAMINE DIAMINOTOLUENE AND THEIR DRVTVS SALTS THEREOF |
0.14 |
0.37 |
0.19 |
| 29214320 |
DIMETHYL TOLUIDNE |
0.26 |
0.32 |
0.11 |
| 29214223 |
DIMETHYL ANILINE |
0.01 |
0.01 |
0.11 |
| 29214390 |
OTHR TOLUIDINES AND THR DRVTVS SLTS THEREOF |
0.00 |
0.00 |
0.08 |
| 29072200 |
HYDROQUINONE (QUINOL) AND ITS SALTS |
0.15 |
0.04 |
0.06 |
| 29215130 |
P-PHENYLENEDIAMINE |
0.08 |
0.08 |
0.04 |
| 29093019 |
OTHER ANISOLE AND THR DRVTVS |
0.00 |
0.08 |
0.03 |
| 29270090 |
OTHER DIAZO-AZO-OR AZOXY-COMPOUNDS |
0.02 |
0.03 |
0.02 |
| 29072100 |
RESORCINOL AND ITS SALTS |
0.00 |
0.00 |
0.01 |
| |
Total |
0.86 |
0.93 |
0.88 |
| SOURCE:DGCI&S |
|
|
|
List of supplying markets for a product imported by South Africa
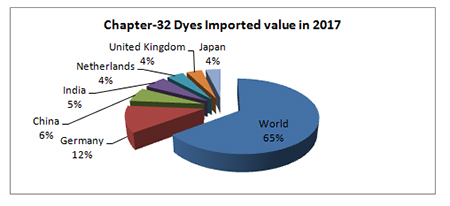
|
|
US Dollar Million |
| Exporters |
Imported value in 2015 |
Imported value in 2016 |
Imported value in 2017 |
| World |
413.07 |
428.46 |
481.90 |
| Germany |
85.00 |
82.04 |
86.21 |
| China |
44.42 |
40.54 |
47.07 |
| India |
27.38 |
33.35 |
40.65 |
| Netherlands |
20.71 |
29.14 |
31.54 |
| United Kingdom |
27.49 |
28.25 |
29.24 |
| Japan |
22.02 |
26.75 |
27.29 |
| SOURCE:INTRACEN |
|
|
INORGANIC CHEMICALS-TOP ITEMS EXPORTS TO SOUTH AFRICA
|
|
|
US$ in Million |
| HSCode |
Product |
2014-2015-Value |
2015-2016-Value |
2016-2017-Value |
| 28321090 |
OTHER SODIUM SULPHITE |
7.88 |
8.64 |
8.53 |
| 28020010 |
SUBLIMED SULPHUR |
2.28 |
1.49 |
1.66 |
| 28112200 |
SILICON DIOXIDE |
3.42 |
2.13 |
1.45 |
| 28139090 |
OTER SULPHIDES OF NON-METALS NES |
0.93 |
0.87 |
1.25 |
| 28151110 |
FLAKES OF SODIUM HYDROXIDE(NAOH),SOLID |
0.47 |
1.46 |
1.20 |
| 28311010 |
SODIUM DITHIONITES (SODIUM HYDROSULPHITE) |
1.28 |
0.96 |
0.92 |
| 28391900 |
OTHER SODIUM SILICATES |
1.64 |
0.83 |
0.44 |
| 28299030 |
IODATES AND PERIODATES |
0.53 |
0.33 |
0.39 |
| 28273200 |
CHLORIDES OF ALUMINIUM |
0.43 |
0.25 |
0.36 |
| 28417020 |
SODIUM MOLYBDATE |
0.76 |
0.66 |
0.36 |
| |
Total |
19.62 |
17.62 |
16.56 |
| SOURCE:DGCI&S |
|
|
|
List of supplying markets for a product imported by South Africa
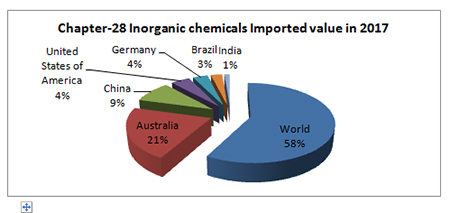
|
|
US Dollar Million |
| Exporters |
Imported value in 2015 |
Imported value in 2016 |
Imported value in 2017 |
| World |
908.30 |
964.23 |
1226.19 |
| Australia |
255.77 |
285.88 |
446.54 |
| China |
156.10 |
161.15 |
189.45 |
| United States of America |
40.93 |
58.04 |
92.25 |
| Germany |
47.62 |
58.61 |
73.64 |
| Brazil |
1.82 |
57.94 |
55.77 |
| India |
28.89 |
25.70 |
26.35 |
| SOURCE:INTRACEN |
|
|
|
ORGANIC CHEMICALS-TOP ITEMS EXPORTS TO SOUTH AFRICA
|
|
|
US$ in Million |
HSCode |
Product |
2014-2015-Value |
2015-2016-Value |
2016-2017-Value |
29173600 |
TEREPHTHALIC ACID AND ITS SALTS |
0.00 |
7.01 |
23.69 |
29335990 |
OTHER CMPNDS CNTNG A PYRIMIDINE RING (W/N HYDRGNTD) OR PIPERAZINE RING IN STRUCTURE |
1.83 |
8.13 |
17.57 |
38237090 |
OTHER INDUSTRIAL FATTY ALCOHOL |
3.15 |
2.82 |
2.23 |
38249025 |
PRECIPITATED SILICA AND SILICA GEL |
2.68 |
3.18 |
2.05 |
29319090 |
OTHER |
0.00 |
0.00 |
1.63 |
29251900 |
OTHR IMIDES AND THR DRVTVS SLTS THEREOF |
0.73 |
0.35 |
1.35 |
29161590 |
OTHER OLEIC LINOLEIC ACIDS AND THEIR SALTS ANDESTRS |
1.30 |
1.65 |
1.35 |
29053100 |
ETHYLENE GLYCOL (ETHANEDIOL) |
0.95 |
0.89 |
1.30 |
29241900 |
OTHER ACYCLIC AMIDES AND THEIR DERIVTVS, SALTS |
1.06 |
0.62 |
1.18 |
38190010 |
BRAKE FLUIDS (HYDRAULIC FLUIDS) |
0.71 |
0.83 |
1.17 |
|
Total |
12.41 |
25.48 |
53.52 |
SOURCE:DGCI&S |
|
|
|
List of supplying markets for a product imported by South Africa
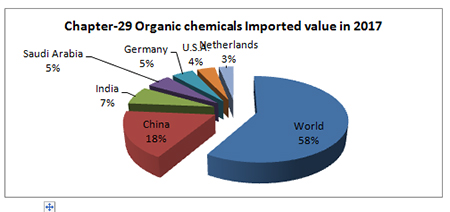
|
|
|
US Dollar Million |
| Exporters |
Imported value in 2015 |
Imported value in 2016 |
Imported value in 2017 |
| World |
1309.82 |
1212.17 |
1348.14 |
| China |
330.96 |
346.86 |
409.33 |
| India |
145.06 |
134.07 |
158.16 |
| Saudi Arabia |
89.11 |
108.17 |
117.87 |
| Germany |
107.97 |
81.98 |
107.28 |
| U.S.A. |
81.61 |
86.92 |
89.25 |
| Netherlands |
66.03 |
58.30 |
72.33 |
| SOURCE:INTRACEN |
|
|
|
AGRO CHEMICALS-TOP ITEMS EXPORTS TO SOUTH AFRICA
|
|
|
US$ in Million |
| HSCode |
Product |
2014-2015-Value |
2015-2016-Value |
2016-2017-Value |
| 38089390 |
OTHER HERBICIDES-ANTI-SPROUTING PRODUCTS |
10.92 |
14.19 |
14.75 |
| 38089290 |
OTHERS FUNGICIDE NES |
6.62 |
6.86 |
7.75 |
| 38089910 |
PESTICIDES, NOT ELSEWHERE SPECIFIED OR INC |
2.85 |
3.39 |
3.35 |
| 38089990 |
OTHER SIMILAR PRODUCTS N.E.S. |
1.19 |
2.09 |
2.00 |
| 38089199 |
OTHER INSECTICIDE NES |
3.71 |
4.89 |
1.76 |
| 38089135 |
CIPERMETHRIN TECHNICAL |
1.32 |
0.57 |
0.68 |
| 38089320 |
2:4 DICHLOROPHENOXY ACTC ACD AND ITS ESTERS |
0.19 |
0.43 |
0.33 |
| 38089310 |
CHLOROMETHYL PHENOXY ACETIC ACID (M.C.P.A) |
0.00 |
0.00 |
0.17 |
| 38089210 |
MANEB |
0.37 |
0.19 |
0.14 |
| 38089250 |
COPPER OXYCHLORIDE |
0.00 |
0.00 |
0.07 |
| |
Total |
27.17 |
32.61 |
31.00 |
| SOURCE:DGCI&S |
|
|
|
List of supplying markets for a product imported by South Africa
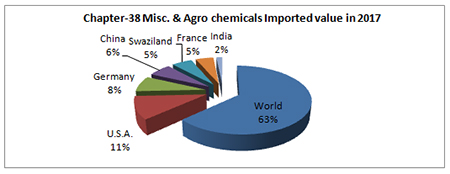
| |
|
US Dollar Million |
| Exporters |
Imported value in 2015 |
Imported value in 2016 |
Imported value in 2017 |
| World |
1444.42 |
1375.90 |
1575.72 |
| U.S.A. |
292.46 |
253.01 |
272.88 |
| Germany |
132.33 |
161.56 |
189.68 |
| China |
171.08 |
114.89 |
153.55 |
| Swaziland |
136.87 |
125.61 |
137.22 |
| France |
116.05 |
94.99 |
120.95 |
| India |
25.11 |
35.86 |
39.46 |
| source:intrace |
|
COSMETICS AND TOILETRIES-TOP ITEMS EXPORTS TO SOUTH AFRICA
| |
|
US$ in Million |
| HSCode |
Product |
2014-2015-Value |
2015-2016-Value |
2016-2017-Value |
| 33061020 |
TOOTH PASTE |
2.03 |
4.27 |
7.74 |
| 34021300 |
NON-IONIC W/N FOR RTL SALE |
1.19 |
1.17 |
1.67 |
| 34011190 |
OTHR SOAP AND ORGNC SURFACE ACTIVE PRODUCTFOR TIOLET |
0.91 |
1.31 |
1.41 |
| 34021190 |
OTHERS(E.G.ALKYLSULPHATES,TECHNICAL DODECYLBENZENE-SUL |
1.41 |
1.20 |
1.37 |
| 33049910 |
CREAMS FACE (EXCL TURMARIC) |
1.58 |
1.30 |
1.28 |
| 33059040 |
HAIR DYES ( NATURAL,HERBAL 0R SYNTHETIC ) |
0.96 |
1.25 |
1.25 |
| 29157050 |
D.C.0. FATTY ACID |
1.17 |
0.85 |
1.04 |
| 38231900 |
OTHER INDUSTRIAL MONOCARBOXYLIC FATTY ACID |
0.49 |
0.81 |
0.86 |
| 25262000 |
NATRL STEATITE CRUSHED/POWDERED |
0.68 |
0.69 |
0.74 |
| 15162039 |
OTHR HYDROGNTD CASTOR OIL(OPL WAX) |
0.88 |
0.66 |
0.69 |
| |
Total |
11.30 |
13.51 |
18.05 |
| SOURCE:DGCI&S |
|
|
|
List of supplying markets for a product imported by South Africa
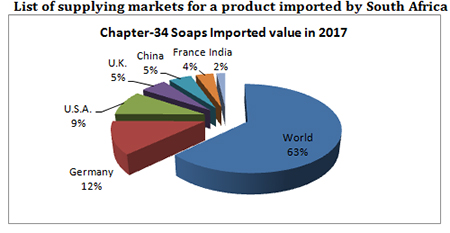
|
|
|
US Dollar Million |
| Exporters |
Imported value in 2015 |
Imported value in 2016 |
Imported value in 2017 |
| World |
274.64 |
271.33 |
280.23 |
| Germany |
43.94 |
50.38 |
53.95 |
| United States of America |
42.62 |
37.90 |
40.94 |
| United Kingdom |
20.43 |
25.01 |
24.01 |
| China |
21.34 |
20.89 |
21.39 |
| France |
14.12 |
14.35 |
16.49 |
| India |
5.87 |
6.10 |
8.09 |
| SOURCE:INTRACEN |
|
|
|
ESSENTIAL OILS-TOP ITEMS EXPORTS TO SOUTH AFRICA
|
|
|
US$ in Million |
| HSCode |
Product |
2014-2015-Value |
2015-2016-Value |
2016-2017-Value |
| 33012926 |
GINGER OIL |
0.25 |
0.47 |
0.26 |
| 33021010 |
SYNTHETIC FLAVOURING ESSENCES |
0.24 |
0.00 |
0.21 |
| 33012590 |
OTHERS |
0.06 |
0.03 |
0.18 |
| 33012932 |
NUTMEG OIL |
0.21 |
0.14 |
0.12 |
| 33011990 |
OTHERS |
0.04 |
0.06 |
0.06 |
| 33012990 |
OTHERS |
0.03 |
0.03 |
0.04 |
| 33012922 |
CORIANDER SEED OIL |
0.06 |
0.03 |
0.03 |
| 33012945 |
CUMIN OIL |
0.01 |
0.02 |
0.03 |
| 33012942 |
LEMON GRASS OIL |
0.01 |
0.01 |
0.02 |
| 33019090 |
OTHR CONC OF ESNL OILS IN FATS/FIXD/WAX LIKE TRPNC BYPRDCTS OF DETERPENATION OF ESNL OILS AQUS DISTLTS/SOLTN ESNL OL |
0.01 |
0.04 |
0.02 |
| |
Total |
0.92 |
0.83 |
0.97 |
| SOURCE:DGCI&S |
|
|
|
List of supplying markets for a product imported by South Africa
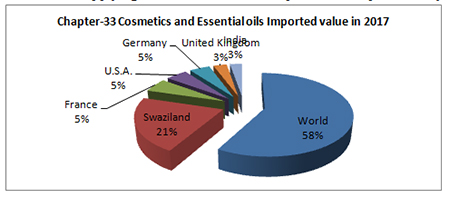
|
|
|
US Dollar Million |
| Exporters |
Imported value in 2015 |
Imported value in 2016 |
Imported value in 2017 |
| World |
869.06 |
894.16 |
1039.25 |
| Swaziland |
315.46 |
307.36 |
381.39 |
| France |
82.91 |
93.12 |
97.12 |
| U.S.A. |
84.14 |
74.85 |
84.46 |
| Germany |
58.77 |
73.91 |
80.56 |
| United Kingdom |
54.56 |
49.27 |
53.12 |
| India |
35.38 |
38.82 |
47.98 |
| SOURCE:INTRACEN |
|
|
|
|
|
BACK |
|