Chairman's Desk
 |
| DR. B.R. GAIKWAD |
| Chairman, CHEMEXCIL |
|
| |
Dear Member-exporters,
I have pleasure to bring to you the 5th issue of the CHEMEXCIL e-Bulletin for the month of Sept. 2016.
You may be aware that CHEMEXCIL has been continuously organizing its Awareness Seminars in various centresfor the benefit of our member-exporters as also part of our drive for increasing its Membership. Accordingly, we had organized one of the Seminars on ‘Handling of Dangerous Goods (Chemicals) Transportation by Sea on 16th Sept. 2016 at Dahej in co-ordination with the Dahej Industries Association.
Further, as part of its export promotional activities, CHEMEXCIL had participated in the 9th INDIACHEM 2016 organised jointly by the Deptt. Of Chemicals &Petrochemicals,Govt. of India and the FICCI from 1st to 3rd Sept. 2016 at the Bombay Exhibition Centre, Mumbai. Along-side the said Exhibition, CHEMEXCIL had also organized free consultations by experts on two important topics, viz. ‘Foreign Trade Policy matters, Free Trade Agreements and Custom Procedures’ on 1st Sept. 2016 and on “Handling of Dangerous Goods (Chemicals) Transportaton by Sea and Road’.
Another Seminar on ‘Forex Management & Trade Finance’ was also organized by us in association with Yes Bank on 29th Sept. 2016 at Mumbai which was followed by our 53rd Annual General Meeting. Brief details of the said Seminars and the Annual General Meeting of the Council are given in this Bulletin. This Bulletin alsocovers details on Exports of top items covered by the Council to Brazil, issuance of Free Sale & Commerce Certificate by the DGFT to Merchant Exporters and other similar useful information.
I am hopeful that you would find this Bulletin informative and useful. The Secretariat looks forward to receiving your valuable feedback and suggestions.
With regards,
Dr. B.R. Gaikwad
Chairman,
CHEMEXCIL
|
BACK |
A Brief report of Dye+Chem Bangladesh 2016 exhibition
As an export promotion measure, CHEMEXCIL has participated in 25thDye+Chem Bangladesh 2016 International Expoorganized by CEMS-Global USA/ Bangladesh from 31st August to 3rd Sept, 2016 at Bashundhara Convention City, Dhaka, Bangladesh. This show was held concurrently with 17thTextech- the biggest and oldest Textile Apparel Technology & Machinery Expo of Bangladesh and 10th Dhaka Int’l Yarn & Fabric Show 2016’, all three combined to focus on the USD 28 Bn Readymade garments (RMG) manufacturing and export Industry of Bangladesh.
The three exhibitions attracted 1050 exhibitors from 23 countries who had put-up stalls in total 15 halls spread over the entire convention city.
Dye+Chem Bangladesh exhibition is an gateway to the Dyes and Fine & Specialty Chemicals sector of Bangladesh and a perfect B2B platform for overseas manufacturers of Dyes & Dyes Intermediate, Basic chemicals to showcase their products under one roof.
The Dye+Chem 2016 exhibition was exclusively held in Hall C/3 where Chemexcil had also organised its Indian pavilion. The Council had booked an area of 150sqmt for organising its India Pavilion wherein 25 Indian exporters had showcased their products and promoted Brand India.
CHEMEXCIL’s India pavilion was visited by Dr. AdarshSwaika, Deputy High Commissioner of India to Bangladesh, HCI, Dhaka &ShriShishir Kothari- First Secretary (Commerce).The members-exporters were happy to interact with the visiting dignitaries.
The Dye+Chem 2016 exhibition evinced good response with more than 150 visitors to Chemexcil stall/ pavilion. These visitors were from local Bangladeshi companies and other markets who were interested in co-operating with Indian companies.
 |
| Dr. AdarshSwaika- Dy High Commissioner, High Commission of India, Dhaka and ShriShishir Kothari- First Secy (Com) at Chemexcil Stall in Indian Pavilion |
|
BACK |
Chemexcil’s participation in 9th India Chem 2016 dated 1st -3rd September-2016 at Mumbai
 |
| Dr. B.R. Gaikwad Chairman, Shri. Satish Wagh-Vice Chairman and Mr. S.G. Bharadi Executive Director Chemexcil interacting with media during India Chem-2016 dated 1st September-2016. |
The 9th edition of the INDIA CHEM exhibition took place from 1st – 3rd September, 2016 at Hall 1 of the Bombay Exhibition Centre in Mumbai. It is the largest event of Chemicals and Petrochemical Industry in India which isjointly organised by the Department of Chemical and Petrochemicals, Government of India and Federation of Indian Chamber of Commerce (FICCI).
The most important objective behind organizing the India Chem series is to highlight the investment possibilities in the country's chemical industry and give a flip to "Make in India" initiative of the Government of India. Leading companies from all over the world predominantly from China, Japan, Russia, Spain, USA, Germany, Italy, Brazil and South East Asian countries are participating both as exhibitors, delegates and visitors. The show was inaugurated bytheHon’ble UnionMinister for Chemicals and Fertilizers, Mr. Ananth Kumar.
The partner states for this event were Andhra Pradesh, Gujarat & Orissa. There were buyers delegation from South America, USA, CIS, West Europe, Middle East and South East Asian countries etc. The show witnessed international participation from China, Japan, Iran, Germany, Turkey and USA.
In order to popularize and promote our exports of the items covered under the purview of CHEMEXCIL viz. Dyes & Dye Intermediates, Inorganic & Organic Chemicals including Agrochemicals, Cosmetics & Toiletries, Essential Oils, Castor Oil etc. as also to assist our member-exporters to explore the market potential in the above countries, the Council had organized a CHEMEXCIL Pavilion by booking 108 sq. mtr. space in this exhibition. Under the umbrella of CHEMEXCIL, 9 member-exporters booked their stalls in the Chemexcil Pavilion and exhibited their products.
The Council had organized free consultations for its member-exporters and visitors of the exhibition on two important topics namely “FOREIGN TRADE POLICY MATTERS, FREE TRADE AGREEMENTS & CUSTOM PROCEDURES” on 1st Sep, 2016 and “HANDLING OF DANGEROUS GOODS (CHEMICALS) TRANSPORTATION BY SEA AND ROAD” on 2nd Sep, 2016.
The consultations were given by the experts in the field and were found to be useful by the visitors who took advantage of it. The Council had also displayed its various publications and other relevant information in the Chemexcil stall through which we have got tremendous response from the visitors.
 |
|
Chemexcil Pavilion in India Chem-2016
|
|
BACK |
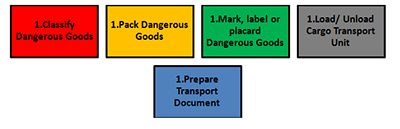
Seminar on "Handling of Dangerous Goods (Chemicals) Transportation by Sea and Road” on 16th Sept 2016 at Fortune Park, Dahej
The Council had organised this seminar on handling of dangerous goods transportation, to create awareness amongstall concerned in the risks involved and detailed understanding of the IMDG Code, proper packaging etc which is meant for safe carriage of dangerous goods. This seminar was organised withthe support of Dahej Industries Association .
Shri S.G Bharadi, Executive DirectorCHEMEXCIL gave his welcome address and advised the participants to benefit from the expertise of the speaker. He also briefed the participants about Council’s other activities, CAPINDIA etc.
Shri M.A Hania, President Dahej Industries Association also attended the seminar and thanked Chemexcil for organising such an event and urged the participants to gain from such events. He also opined about high potential of Dahej for future development.
The key speaker wasShri. Shashi Kallada (Specialist- Dangerous Goods),Ex-Manager Global -Dangerous Goods (Maersk Line) who is well experienced in Merchant Shipping, Packaged Dangerous Goods etc. He covered the areas of classification, packaging, Segregation, Marking, Labelling, Placarding, Documentation & Common non- compliance noticed on Indian export shipments etc.
The event attracted good response with participation of total 40 participants. The participants interacted with the key speaker and also got clarifications on their queries.
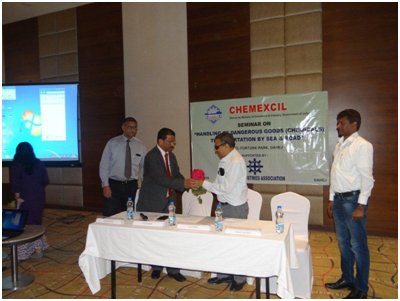 |
| Shri S.G Bharadi, ED Chemexcil welcoming Shri M.A Hania, President, Dahej Industries Association during the seminar on handling of Dangerous Goods (Chemicals) Transportation by Sea & Road at Dahej |
|
BACK |
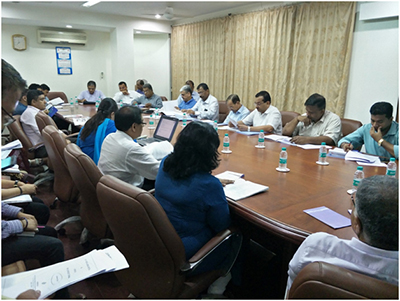
CHEMEXCIL 2ND MEETING OF THE COMMITTEE OF ADMINISTRATION
 |
| The 2nd meeting of the Committee of Administration held on 23rd August 2016 at 2.00 p.m. in the Conference Room of the Council at Mumbai. |
Following Government Nominees & members of Committee had attended the meeting: Shri Sunil Kumar, IAS, Jt. Secretary - EP(CAP), Dept. of Commerce, Ministry of Commerce & Industry, New Delhi, Shri Samir Kumar Biswas, IAS, Jt. Secretary (Chemicals), Dept. of Chem.& Petrochem., Ministry of Chemicals and Fertilizers, New Delhi, Dr. B.R. Gaikwad, Chairman, Shri Satish Wagh, Vice Chairman, Shri S.G. Mokashi, Addl. Vice Chairman, ShriBhupendra Patel , Member and Gujarat Regional Chairman, ShriAbhay V. Udeshi, Chairman, Castor Oil Panel, ShriHarin D. Mamlatdarna, Member- Chemical Panel , Shri Nitin Nabar , Member- Dyes & Dye Intermediates Panel , Shri Bharat Mehta, Member- ME Panel.
|
BACK |
Seminar on "Forex Management & Trade Finance" on 29th September 2016 at The Banquet Hall 4, Garware Club House, Wankhede Stadium, Mumbai
 |
| Mr. Abhishek from Trade Finance division , Yes Bank delivering his speech on Interest Rate Equalisation Scheme, buyer’s credit, suppliers credit, Mr. S.G. Bharadi Executive Dirctor Chemexcil, Mr. Shishir Chaturvedi, Group Executive Vice President, Yes bank and Dr. B.R. Gaikwad Chairman Chemexcil |
To create awareness about various aspects of "Forex Management/ Risk Mitigation and Trade Finance" especially among MSME members, the council had organized this seminar in association with YES BANK on 29th September 2016 at The Banquet Hall 4, Garware Club House, Wankhede Stadium, Mumbai
The participants asked several queries on forward premium, Interest Rate Equalisation Scheme etc. The queries of participants where answered satisfactorily by Sr. executives of Yes Bank who had made presentations.
|
BACK |
CHEMEXCIL’S 53RD ANNUAL GENERAL MEETING DATED 29TH SEPTEMBER-2016 AT THE BANQUET HALL 4, GARWARE CLUB HOUSE, WANKHEDE STADIUM, MUMBAI
 |
| Mr. S.G. Bharadi Executive Director Chemexcil, Dr. B.R. Gaikwad Chairman Chemexcil, Mr. S.K. Ranjan Dy. Secretary, EP (CAP), Ministry of Commerce & Industry ,Government of India, Mr. S.G. Mokashi, Additional Vice Chairman and Member Basic Inorganic and Organic Chemicals including Agrochemicals, Chemexcil |
53rd Annual General Meeting of the BASIC CHEMICALS, COSMETICS AND DYES EXPORT PROMOTION COUNCIL, Mumbai was held on Thursday the 29th September, 2016 at 5.45 pm in the Garware Club House, Wankhede Stadium, ‘D’ Road, Churchagate, Mumbai - 400 020 to transact the following as per Article 34.2 of the Byelaws of the Council.
- Annual Report of the Working Committee for the year ended as on 31st March, 2016.
- The Audited Income and Expenditure Accounts for the year ended as on 31st March, 2016.
- Balance Sheet as on 31st March, 2016.
- To place on record the names of the Committee Members under Para 34.2 (b)
- To appoint and fix the remuneration of the Auditors as required under Para 34.2 (c)
|
BACK |
EXPORT STRATEGY BRAZIL
 |
The Federative Republic of Brazil is Latin America's largest economy. With 3,290,000 square miles, bordering 10 other countries and with 4,650 miles of coastline, Brazil is the largest country in Latin America and fifth largest in the world. Brazil’s 2014 Gross Domestic Product (GDP) of US$2.3 trillion ranks Brazil as the world’s seventh-largest economy. Annual growth during 2014 dropped to 0.1% due to reduced demand for Brazilian exports in Europe and Asia and modest consumer demand from Brazil’s large middle class.
During the past two decades, the country has prioritized macroeconomic policies that control inflation and promote economic growth. Recently, inflation has increased, reaching 8.47% in May 2015. Urban unemployment was at 6.4% in April 2015, increasing from 4.9% in mid-2014; and wages continue to increase. Brazil’s Central Bank has been steadily raising interest rates to combat inflation, from a historic low of 7.25% in October 2012 to 13.75%.
Brazil represents an excellent export partner for experienced Indian exporters. Major reasons to export to Brazil include:
- Brazil’s population of 202 million is the fifth largest in the world, representing nearly 3 percent of global consumers.
- At the same time, Brazil has the highest per capita income of any of the BRICS, with more than half of its population defined as middle-class, earning between $11,500 and $29,000 per year.
- Brazil is also traditional leader among emerging markets. A BRICS member, it is now considered by many multi-national companies as an essential market for truly global businesses.
- Brazil has a natural affinity for the United States and a high regard for our products, brands and technology. Brazil’s existing affinity for the United States has been further reinforced through the Scientific Mobility Program, a government scholarship that has already funded 32,716 students to study for one year in the United States. One of the stated aims of the program is increasing science and technology cooperation between our countries.
- The Brazilian Government is actively cultivating relationships with international and Indian businesses and prioritizing macroeconomic stability.
Market Challenges
Brazil has a large and diversified economy that offers Indian companies many opportunities to partner and to export their goods and services. Doing business in Brazil requires intimate knowledge of the local environment, including both the direct as well as the indirect costs of doing business in Brazil (referred to as “CustoBrasil”). Such costs are often related to distribution, government procedures, employee benefits, environmental laws, and a complex tax structure. Logistics pose a particular challenge, given the lack of sufficient infrastructure to keep up with nearly a decade of economic expansion. In addition to tariffs, Indian companies will find a complex customs and legal system.
The Government of Brazil (GOB) is the nation’s largest buyer of goods and services. Navigating the government procurement process can be challenging.Indian exporters may find themselves at a competitive disadvantage if they do not have a significant in-country presence – whether via established partnerships with Brazilian entities or some type of company subsidiary -- as well as the patience and financial resources to respond to legal challenges and bureaucratic issues.
The unfolding scandal connected to energy giant Petrobras poses another challenge to government and business, increasing uncertainty and creating a drag on growth. In response, senior government officials have pledged to support the on-going legal and investigative processes, and Petrobras has taken concrete steps to improve internal compliance mechanisms and restore confidence. While the economic and public relations consequences have been severe, Brazil may yet seize a silver lining: a comprehensive commitment to fight corruption could ultimately improve the business climate, benefitting local and international companies alike.
Economy Overview
Characterized by large and well-developed agricultural, mining, manufacturing, and service sectors, and a rapidly expanding middle class, Brazil's economy outweighs that of all other South American countries, and Brazil is expanding its presence in world markets. Since 2003, Brazil has steadily improved its macroeconomic stability, building up foreign reserves, and reducing its debt profile by shifting its debt burden toward real denominated and domestically held instruments. Since 2008, Brazil became a net external creditor and all three of the major ratings agencies awarded investment grade status to its debt.
After strong growth in 2007 and 2008, the onset of the global financial crisis hit Brazil in 2008. Brazil experienced two quarters of recession, as global demand for Brazil's commodity-based exports dwindled and external credit dried up. However, Brazil was one of the first emerging markets to begin a recovery. In 2010, consumer and investor confidence revived and GDP growth reached 7.5%, the highest growth rate in the past 25 years. GDP growth has slowed since 2011, due to several factors, including overdependence on exports of raw commodities, low productivity, high operational costs, persistently high inflation, and low levels of investment. After reaching historic lows of 4.8% in 2014, the unemployment rate remains low, but is rising. Brazil's traditionally high level of income inequality has declined for the last 15 years.
Brazil’s fiscal and current account balances have eroded during the past four years as the government attempted to boost economic growth through targeted tax cuts for industry and incentives to spur household consumption. After winning reelection in October 2014 by a historically narrow margin, President Dilma ROUSSEFF appointed a new economic team led by Finance Minister Joaquim LEVY, who introduced a fiscal austerity package intended to restore the primary account surplus (before interest expenditures are included) to 1.2% of GDP and preserve the country's investment-grade sovereign credit rating. LEVY encountered political headwinds and an economy facing more challenges than he anticipated. The target for the primary account surplus fell to a deficit of 2%, and two of the three main credit rating agencies downgraded Brazil to “junk” status.
Brazil seeks to strengthen its workforce and its economy over the long run by imposing local content and technology transfer requirements on foreign businesses, by investing in education through social programs such as BolsaFamilia and the Brazil Science Mobility Program, and by investing in research in the areas of space, nanotechnology, healthcare, and energy.
GDP (purchasing power parity):$3.192 trillion (2015 est.),$3.32 trillion (2014 est.),$3.317 trillion (2013 est.)
Industries:-Textiles, shoes, chemicals, cement, lumber, iron ore, tin, steel, aircraft, motor vehicles and parts, other machinery and equipment
Exports: -$189.1 billion (2015 EST.), $225.1 billion (2014 EST.)
Exports Commodities:-Transport equipment, iron ore, soybeans, footwear, coffee, automobiles
Exporting Partners: - China 18.6%, US 12.7%, Argentina 6.7%, Netherlands 5.3% (2015)
Imports: -$174.2 billion (2015 EST.)/$229.2 billion (2014 EST.)
Import Commodities:- Machinery, electrical and transport equipment, chemical products, oil, automotive parts, electronics
Import Partners: - China 17.9%, US 15.6%, Germany 6.1%, Argentina 6% (2015)
Chemexcil Exports to Brazil
| Chapter No./Panel |
2013-2014 (Actual) |
2014-2015 (Actual) |
% over 2013-14 |
2015-16 (Provisional) |
% over 2014-15 |
| (32) Dyes & (29) Dye Intermediates |
99.23 |
117.42 |
18.33 |
75.27 |
-35.90 |
| (28) Inorganic, (29) Organic & (38) Agro chemicals |
400.66 |
398.29 |
-0.59 |
344.60 |
-13.48 |
| (33) Cosmetics, (34) Soaps, Toiletries and (33) Essential oils |
28.78 |
21.77 |
-24.36 |
21.07 |
-3.22 |
| (15) Castor Oil |
9.60 |
2.37 |
-75.31 |
2.15 |
-9.28 |
| Total |
538.27 |
539.85 |
0.29 |
443.09 |
-17.92 |
List of supplying markets for a product imported by Brazil (India’s Competitor Countries)
| In USD million |
| Dyes |
Inorganic Chemicals |
Organic Chemicals |
Agro chemicals |
Cosmetics |
Soaps |
Castor Oil |
| (Ch.32) |
(Ch.28) |
(Ch.29) |
(Ch.38 |
(Ch.33) |
(Ch.34) |
(Ch.15) |
| United States of America |
United States of America |
China |
United States of America |
Argentina |
United States of America |
Indonesia |
| China |
China |
United States of America |
France |
United States of America |
Germany |
Portugal |
| Germany |
Trinidad and Tobago |
Germany |
Argentina |
France |
Mexico |
Uruguay |
| Mexico |
Germany |
Switzerland |
Germany |
Germany |
Uruguay |
Malaysia |
| Spain |
Spain |
France |
China |
Spain |
China |
Argentina |
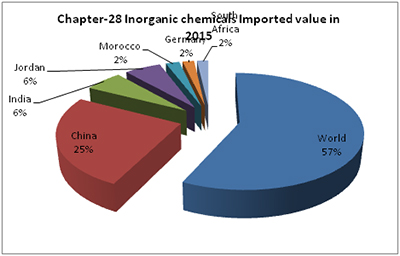
Chapter no. 28 Inorganic chemicals, precious metal compound, isotopes imported by Brazil
| In USD million |
Exporters |
Imported value in 2015 |
| World |
1941.11 |
| United States of America |
710.77 |
| China |
272.69 |
| Trinidad and Tobago |
155.33 |
| Germany |
97.34 |
| Spain |
92.74 |
| India |
9.66 |
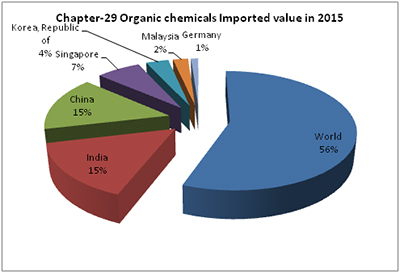
Product: 29 Organic chemicalsimported by Brazil
| In USD million |
| Exporters |
Imported value in 2015 |
| World |
9292.52 |
| China |
1959.67 |
| United States of America |
1899.14 |
| Germany |
1112.48 |
| Switzerland |
649.49 |
| India |
537.55 |
| France |
402.83 |
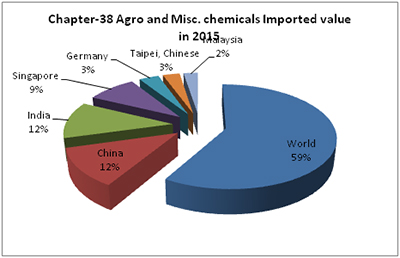
Product: 38 Miscellaneous chemical productsimported by Brazil
| In USD million |
| Exporters |
Imported value in 2015 |
| World |
4646.71 |
| United States of America |
1329.65 |
| France |
645.94 |
| Argentina |
375.35 |
| Germany |
338.32 |
| China |
269.44 |
| India |
186.47 |
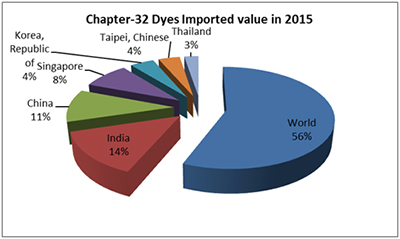
Product: 32 Tanning, dyeing extracts, tannins, derivs,pigmentsetcimported by Brazil
| In USD million |
| Exporters |
Imported value in 2015 |
World |
1148.16 |
United States of America |
212.32 |
China |
204.62 |
India |
117.17 |
Germany |
113.49 |
Mexico |
66.78 |
Spain |
56.89 |
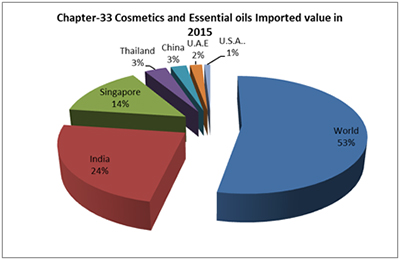
Product: 33 Essential oils, perfumes, cosmetics, toileteriesimported by Brazil
| In USD million |
Exporters |
Imported value in 2015 |
| World |
823.56 |
| Argentina |
239.32 |
| United States of America |
156.45 |
| France |
118.60 |
| Germany |
32.50 |
| Spain |
29.95 |
| India |
17.33 |
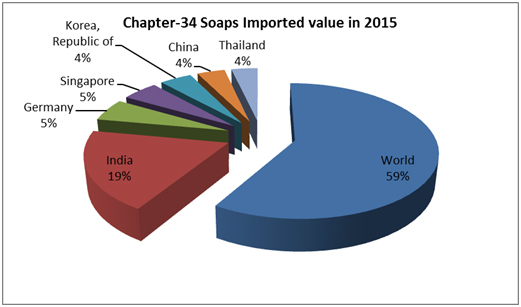
Product: 34 Soaps, lubricants, waxes, candles, modelling pastesimported by Brazil
| In USD million |
| Exporters |
Imported value in 2015 |
| World |
522.66 |
| United States of America |
204.92 |
| Germany |
78.35 |
| Mexico |
32.25 |
| Uruguay |
28.02 |
| China |
24.47 |
| India |
15.94 |
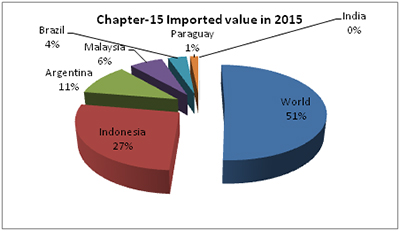
Product: 15 Animal,vegetable fats and oils, cleavage products, etc imported by Brazil
| In USD million |
| Exporters |
Imported value in 2015 |
| World |
838.22 |
| Indonesia |
280.26 |
| Portugal |
170.35 |
| Uruguay |
64.26 |
| Malaysia |
62.23 |
| Argentina |
61.10 |
| India |
2.41 |
|
BACK |
Chemexcil top items of exports to Brazil
GroupwiseCountrywise Exports for the year 2013-2014 , 2014-2015 & 2015-2016
| DYES - Top Items Exports |
|
US$ in million |
| HSCode |
Product |
2013-2014 |
2014-2015 |
2015-2016 |
| 32041680 |
REACTIVE BLACKS |
10.87 |
14.36 |
8.69 |
| 32041751 |
PIGMENT BLUE 15 (PATHALOCYANINE BLUE) |
11.54 |
9.80 |
7.99 |
| 32041218 |
ACID BLACKS |
12.97 |
12.56 |
6.75 |
| 32041759 |
OTHER PIGMENT BLUE |
5.30 |
6.46 |
6.59 |
| 32041650 |
REACTIVE BLUES |
7.78 |
9.31 |
5.97 |
| 32041630 |
REACTIVE REDS |
5.04 |
8.80 |
4.86 |
| 32042010 |
OPTICAL WHITENING AGETNS |
5.48 |
6.82 |
3.96 |
| 32041761 |
PIGMENT GREEN 7(PATHALOCYANINE GREEN) |
5.32 |
5.17 |
3.74 |
| 32041973 |
SOLVENT BASED COLOURING MATTERS: REDS |
2.31 |
6.22 |
2.84 |
| 32041982 |
FOOD YELLOW 4 (TARTRAZINE) |
2.67 |
2.58 |
1.99 |
| 32041984 |
FOOD RED 9 (AMARANTH) |
1.33 |
2.26 |
1.56 |
| 32041610 |
REACTIVE YELLOWS |
3.70 |
5.10 |
1.22 |
| 32041217 |
ACID BROWNS |
1.35 |
0.95 |
1.08 |
| 32021000 |
SYNTHETIC ORGANIC TANNING SUBSTANCES |
1.68 |
2.24 |
1.07 |
| 32041739 |
OTHER PIGMENT RED |
1.48 |
1.70 |
1.05 |
| |
Country Totals |
78.83 |
94.33 |
59.37 |
| DYE INTERMEDIATES - Top Items Exports |
|
US$ in million |
| HSCode |
Product |
2013-2014 |
2014-2015 |
2015-2016 |
| 29049040 |
ORHTO NITROCHLOROBENZENE |
1.97 |
2.11 |
0.81 |
| 29222160 |
H-ACID |
0.80 |
0.52 |
0.64 |
| 29049070 |
SODIUM META NITRO-BENZENE SULPHONATE |
0.39 |
0.43 |
0.37 |
| 29041040 |
VINYL SULPHONE |
0.13 |
0.18 |
0.36 |
| 29049020 |
DINITROCHLOROBENZENE |
0.65 |
0.74 |
0.36 |
| 29214215 |
2-4-5-TRICHLORO ANILINE |
0.91 |
0.91 |
0.33 |
| 29222140 |
GAMMA ACID |
0.70 |
0.39 |
0.22 |
| 29225012 |
METHYL ANTHRANILATE |
0.24 |
0.33 |
0.20 |
| 29214213 |
DICHLOROANILINE |
0.17 |
0.17 |
0.18 |
| 29222924 |
PHENYL J.ACID (PHENYL-2-AMINO-8-NAPHTHOL- 7 SULPHONIC ACID |
0.14 |
0.24 |
0.17 |
| 29041020 |
1:5 NAPHTHALENE DISULPHONIC ACID (ARMSSTRONG'S ACID) |
0.41 |
0.17 |
0.11 |
| 29214521 |
BRONNER'S ACID (2-NAPHTHYLAMINE-6, SULPHONIC ACID) |
0.01 |
0.02 |
0.08 |
| 29214212 |
ORTHO CHLORO PARANITROANILINE |
0.03 |
0.01 |
0.07 |
| 29214910 |
XYLIDINE |
0.19 |
0.22 |
0.04 |
| 29049050 |
PARA NITROCHLOROBENZENE |
0.00 |
0.00 |
0.04 |
| |
Country Totals |
6.74 |
6.45 |
3.99 |
| INORGANIC CHEMICALS - Top Items Exports |
|
US$ in million |
| HSCode |
Product |
2013-2014 |
2014-2015 |
2015-2016 |
| 28020010 |
SUBLIMED SULPHUR |
1.00 |
0.86 |
1.36 |
| 28191000 |
CHROMIUM TRIOXIDE |
0.32 |
0.05 |
1.02 |
| 31043000 |
POTASSIUM SULPHATE |
0.00 |
1.30 |
0.90 |
| 28299030 |
IODATES AND PERIODATES |
0.43 |
0.62 |
0.76 |
| 38151100 |
SUPPORTED CATALYSTS WITH NICKEL OR NICKEL COMPOUNDS AS THE ACTIVE SUBSTANCE |
0.91 |
0.20 |
0.54 |
| 28299010 |
PERCHLORATES |
0.47 |
0.14 |
0.49 |
| 28311020 |
SODIUM SULPHOXYLATE (INCLUDING SODIUM FORMALDEHYDE SULPHOXYLATE) |
0.24 |
0.44 |
0.36 |
| 28332990 |
OTHER SULPHATE; PEROXOSULPHATES(PERSULPHATES) |
0.12 |
0.23 |
0.32 |
| 38029019 |
OTHER ACTIVATED NATURAL MINERAL PRODUCTS |
0.40 |
0.00 |
0.27 |
| 38249021 |
ELECTROPLATING SALTS |
0.53 |
0.43 |
0.26 |
| 28275110 |
SODIUM BROMIDE |
0.00 |
0.00 |
0.19 |
| 28047020 |
PHOSPHORUS RED |
0.27 |
0.10 |
0.18 |
| 28429010 |
ARSENITES AND ARSENATES |
0.01 |
0.11 |
0.17 |
| 28139090 |
OTHER SULPHIDES OF NON METALS |
0.05 |
0.10 |
0.13 |
| 28322090 |
OTHER SULPHITE |
0.00 |
0.00 |
0.10 |
| |
Country Totals |
4.75 |
4.57 |
7.04 |
| ORGANIC CHEMICALS - Top Items Exports |
|
US$ in million |
| HSCode |
Product |
2013-2014 |
2014-2015 |
2015-2016 |
| 29329900 |
OTHER HETROCYCLIC COMPOUNDS WITH OXYGEN HETERO-ATOMS (S) ONLY |
24.63 |
29.31 |
25.65 |
| 29309099 |
OTHER ORGANO- SULPHUR COMPOUNDS |
0.15 |
8.01 |
16.64 |
| 29241900 |
OTHER ACYCLIC AMIDES (INCLUDING ACYCLIC CARBOMATES) AND THEIR DERIVATIVES SALTS THEREOF |
6.13 |
8.38 |
7.43 |
| 38237090 |
OTHER INDUSTRIAL FATTY ALCOHOL |
9.33 |
7.69 |
5.97 |
| 29270090 |
OTHER DIAZO-AZO OR AZOXY COMPOUNDS |
0.69 |
0.83 |
5.68 |
| 29333990 |
OTHER COMPOUNDS CONTG. AN UNFUSED PYRIDINE RING (W/N) HYDROGENATED STRUCTURE |
3.28 |
4.05 |
5.11 |
| 29182390 |
OTHER ESTERS OF SALICYLIC ACID AND THEIR SALTS |
2.55 |
2.83 |
4.60 |
| 29153990 |
OTHER ESTERS OF ACETIC ACID |
5.10 |
5.07 |
3.61 |
| 29156020 |
PENTANOIC ACIDS, THEIR SALTS AND ESTERS |
1.78 |
1.70 |
2.86 |
| 29225090 |
OTHER- FRUSEMIDE, AMINODIAL, N-ACETYL ANTHRANILIC ACID, DOMPERIDONE |
0.93 |
1.87 |
2.64 |
| 29072990 |
OTHER POLYPHENOLS/PHENOL-ALCOHOLS |
2.86 |
2.68 |
2.44 |
| 29051700 |
DODECAN-1-OL (LAURYL ALCOHOL) HEXADECAN-1OL (CETYL ALCOHOL) AND OCTADECAN-1-OL (STEARYL ALCOHOL) |
4.05 |
3.26 |
2.05 |
| 29337900 |
OTHER LACTAMS |
2.84 |
3.86 |
1.98 |
| 29321990 |
OTHER COMPOUNDS CONTAINING AN UNFUSED FURAN RING (WHETHER OR NOT HYDROGENATED) IN THE STRUCTURE |
1.58 |
1.73 |
1.91 |
| 29159090 |
OTHER SATURATED ACYCLIC MONOCARBAXYLIC ACID ETC & THEIR DERIVATIVES |
1.94 |
3.03 |
1.86 |
| |
Country Totals |
67.85 |
84.31 |
90.41 |
| AGRO CHEMICALS - Top Items Exports |
|
US$ in million |
| HSCode |
Product |
2013-2014 |
2014-2015 |
2015-2016 |
| 38089199 |
OTHER INSECTICIDE N.E.S. |
165.99 |
157.69 |
72.97 |
| 38089910 |
PESTICIDES, NOT ELSEWHERE SPECIFIED OR INCLUDED |
61.34 |
32.77 |
67.61 |
| 38089290 |
OTHER FUNGICIDES |
9.85 |
22.85 |
64.26 |
| 38089990 |
OTHER SIMILAR PRODUCTS N.E.S. |
16.32 |
45.14 |
22.16 |
| 38089320 |
2:4 DICHLOROPHENOXY ACTC ACD & ITS ESTERS |
12.30 |
1.44 |
10.84 |
| 38089390 |
OTHER HERBICIDES, ANTI-S-SPROUTING PRODUCTS AND PLANT GROWTH REGULATORS |
1.66 |
2.41 |
10.73 |
| 38089135 |
CIPERMETHRIN TECHNICAL GRADE |
12.00 |
10.22 |
7.12 |
| 38089137 |
SYNTHETIC PYRETHRUM |
13.92 |
14.77 |
2.79 |
| 38089113 |
D.D.V.P. (DIMETHYL- DICHLORO- VINYL PHOSPHATE) |
0.15 |
0.14 |
0.06 |
| |
Country Totals |
293.52 |
287.43 |
258.55 |
| COSMETICS & TOILETRIES - Top Items Exports |
|
US$ in million |
| HSCode |
Product |
2013-2014 |
2014-2015 |
2015-2016 |
| 34021190 |
OTHERS (E.G. ALKYL SULPHATES TECH. DODECYL BENZENE-SULPHONATES, ETC.) |
10.23 |
9.15 |
9.44 |
| 34021300 |
NON-IONIC W/N FOR RETAIL SALE |
4.76 |
3.69 |
4.41 |
| 33030090 |
OTHER PERFUMES AND TOILET WATERS |
3.94 |
3.45 |
3.90 |
| 15162039 |
OTHER HYDROGENATED CASTOR OIL (OPAL WAX) |
3.29 |
1.28 |
1.07 |
| 29157040 |
HCO FATTY ACID(INCLUDING 12-HYDROXY STEARIC ACID) |
3.18 |
0.90 |
0.63 |
| 38231900 |
OTHER INDUSTRIAL MONOCARBOXYLIC FATTY ACID |
0.87 |
0.77 |
0.57 |
| 34022090 |
OTHER ORGANIC SURFACE ACTIVE AGENTS PREPERATIONS PUT UP FOR RETAIL SALE |
0.36 |
0.33 |
0.44 |
| 38099110 |
TEXTILE ASSISTANTS MORDANTING AGENTS |
0.05 |
0.12 |
0.28 |
| 38099190 |
OTHER TEXTILE ASSISTANTS |
0.50 |
0.47 |
0.21 |
| 29157050 |
D.C.O. FATTY ACID |
0.22 |
0.54 |
0.20 |
| 34029091 |
WASHING AND CLEANING PREPNS HAVING BASIS OF SOAP/OTHER ORGANIC SURFACE ACTIVE (OTHER PREPNS) |
0.11 |
0.34 |
0.18 |
| 15180029 |
OTHER CASTOR OIL DEHYDRATED |
0.10 |
0.00 |
0.10 |
| 34029099 |
OTHER (OTHER PREPARATIONS) NES |
0.13 |
0.16 |
0.04 |
| 33059040 |
HAIR DYES(NATURAL, HERBAL OR SYNTHETICS) |
0.08 |
0.01 |
0.03 |
| 33074900 |
OTHER ODORIFERROUS PREPNS USED FOR DEODORING ROOM-OTHERS (EXCL.AGARBATTI) |
0.01 |
0.01 |
0.03 |
| |
Country Totals |
27.81 |
21.21 |
21.51 |
| ESSENTIAL OIL - Top Items Exports |
|
US$ in million |
| HSCode |
Product |
2013-2014 |
2014-2015 |
2015-2016 |
| 33012590 |
OTHER MINT OILS |
10.66 |
3.53 |
1.00 |
| 33012990 |
ESSENTIAL OILS OF GERANIUM |
0.30 |
0.47 |
0.24 |
| 33012932 |
NUTMEG OIL |
0.28 |
0.17 |
0.19 |
| 33012400 |
PEPPERMINT OIL(MENTHA PIPERITA) |
0.34 |
0.25 |
0.08 |
| 33011990 |
CITRONELLA OIL CEYLON TYPE INCLUDING & CONCETRATE |
0.00 |
0.00 |
0.05 |
| 33012924 |
EUCALYPTUS OIL |
0.01 |
0.00 |
0.04 |
| 33012922 |
CORIANDER SEED OIL |
0.03 |
0.03 |
0.03 |
| 33019032 |
MUSTARD OIL AROMA/ESSENTIAL OIL |
0.00 |
0.00 |
0.02 |
| 33012918 |
CINNAMON LEAF OIL |
0.01 |
0.03 |
0.02 |
| 33019090 |
OTHER AQUEOUS SOLUTION OF ESSENTIAL OILS. |
0.00 |
0.00 |
0.02 |
| 33012944 |
DAVANA OIL |
0.01 |
0.00 |
0.02 |
| 33012921 |
CLOVE LEAF/STEM OIL |
0.03 |
0.16 |
0.02 |
| 33019033 |
ESSENCE OF AMBRETTOLIE (AMBRETTE SEED OIL ESSENCE) |
0.07 |
0.00 |
0.01 |
| 33012926 |
GINGER OIL |
0.02 |
0.01 |
0.01 |
| 33012946 |
CELERY SEED OIL |
0.06 |
0.02 |
0.01 |
| |
Country Totals |
11.81 |
4.69 |
1.78 |
|
BACK |
India's first Central Institute of Chemical Engineering and Technology to come up in Mumbai?
India's first Central Institute of Chemical Engineering and Technology is being planned to be set up in the country's commercial capital here, Chemicals and Fertilizer Minister Ananth Kumar said on Thursday.
Mumbai: India's first Central Institute of Chemical Engineering and Technology is being planned to be set up in the country's commercial capital here, Chemicals and Fertilizer Minister Ananth Kumar said on Thursday.
"The government is planning to set up Central Institutes of Chemical Engineering and Technology at different locations where the chemical industry has significant presence. The first such institute will come up in Mumbai," Ananth Kumar said at the inauguration of the three-day India Chem 2016 expo here being organised by his ministry jointly with industry chamber FICCI.
Noting that the Indian chemical industry, which employs nearly 2 million people, requires 8.5 lakh skilled technicians, the minister said that current infrastructure to impart skill training is inadequate.
"The Indian chemical industry is expected to grow at 9 per cent per annum to become a $226 billion sector driven by growth in end-use industries and government initiatives," he said.
"India's long coastline, large refining capacity and a satisfactory R&D capacity are the strengths for the growth of the chemical industry, but ease of doing business needs to improve further," he said.
Ananth Kumar also said imports from China and Southeast Asia continue to dominate, as raw material cost and availability pose challenges for domestic businesses.
Iran is the partner country at this ninth edition of what is billed as India's largest chemicals and petrochemicals event.
A host of other countries such as China, Japan, Turkey, Singapore, Vietnam, Britain, South Korea, Belgium and Taiwan are participating in India Chem 2016.
Gujarat, Odisha and Andhra Pradesh are taking part as partner states in the event, which is "expected to attract big ticket investments from foreign shores to boost India's chemical industry", the government said.
Iran's participation here assumes significance following the signing earlier this year between India, Iran and Afghanistan of the Chabahar trilateral transit and trade corridor deal that will ensure easy movement of goods between the three countries, bypassing Pakistan.
(Ref. http://zeenews.india.com/news/mumbai/indias-first-central-institute-of-chemical-engineering-and-technology-to-come-up-in-mumbai_1924875.html dated 01.09.2016) |
|
BACK |
Indian chemical industry is expected to grow at 9% p.a. to become a US$226bn sector: Ananth Kumar
India’s long coastline, large refining capacity and a satisfactory R&D capacity are the strengths for the growth of the chemical industry, but observed that ease of doing business still needs to improve further. He said imports from China and South East Asia continue to dominate, as raw material cost and availability pose challenges for domestic businesses. said Union Minister for Chemicals & Fertilizers, Ananth Kumar.
Union Minister for Chemicals & Fertilizers, Ananth Kumar asserted that the Indian chemical industry is expected to grow at 9% p.a. to become a US $ 226 bn sector, driven by growth in end-use industries and government initiatives. The present size of the industry is US $ 147 bn.
Speaking at the inauguration of the 9th edition of biennial IndiaChem International Exhibition and Conference in Mumbai today, the minister observed that the current PCPIR (Petroleum, Chemicals & Petrochemicals Investment Regions) Policy needs fine tuning to make it more pragmatic and practical. He requested the industry leaders and experts gathered at IndiaChem to offer suggestions over the next one month to make the policy more vibrant.
Ananth Kumar said India’s long coastline, large refining capacity and a satisfactory R&D capacity are the strengths for the growth of the chemical industry, but observed that ease of doing business still needs to improve further. He said imports from China and South East Asia continue to dominate, as raw material cost and availability pose challenges for domestic businesses.
Ananth Kumar asserted that ‘Make In India’ campaign is the key driver for the chemical industry as there exist opportunity for import substitution in many petrochemical derivatives. He further said that implementation of GST would bring manufacturing costs down, thus making Indian products competitive.
The minister also observed that the Indian chemical industry, which employs nearly 2 million people, requires 8.5 lakh skilled technicians. He lamented that current infrastructure to impart skill training is inadequate, as a result most of the training is taking place on site.
Ananth Kumar said that in a bid address the issue of skill development, the government is planning to set up Central Institutes of Chemical Engineering & Technology at different locations where the chemical industry has significant presence. The minister announced that the first such institute will come up in Mumbai.
Ananth Kumar also launched PCPIR logo and website on the occasion of IndiaChem 2016 inauguration.
Minister of State for Chemicals & Petrochemicals, MansukhbhaiMandaviya, Secretary, Chemicals & Petrochemicals Anuj Kumar Bishnoi, Bangladesh Minister for Industries, Amir Hossain Amu, leaders of chemical industry were present on the occasion.
IndiaChem, jointly organized by the Department of Chemicals & Petrochemicals and FICCI is the largest event of chemicals and petrochemicals industry in India. Iran is the partner country this year, while Gujarat, Andhra Pradesh and Odisha are participating as partner states. A host of other countries such as China, Japan, South Korea, Taiwan, Singapore, Vietnam, Turkey, US and Belgium are participating through institutional and corporate stalls.
|
BACK |
India-Chile PTA to be signed soon; exports set to double
An expanded India-Chile Preferential Trade Agreement (PTA) will be signed in New Delhi next week. Confirming this, senior officials told FE: “Under the expanded PTA, 86% of India’s exports to Chile will get covered with concessions, which is likely to result in doubling of our exports in the near future.”
Talking to FE, Andres Barbe, ambassador of Chile to India, said, “The inking of the agreement, which was scheduled for later this year, has now been preponed. Instead of Eduardo Frei, extraordinary and plenipotentiary ambassador on special mission to the Asia-Pacific of Chile coming here for the signing, it will be at an ambassadorial level in New Delhi.” Barbe said, “The trade agreement would be in the interest of both the countries. We want Chilean products to come to India and Indian products to reach our markets.” Chile has offered tariff concessions on agricultural products, organic & inorganic chemicals, pharmaceuticals, plastic & rubber articles, textiles, apparel, articles of iron/steel & copper, machinery & equipment.
India’s export basket with Chile is diversified and keeping in view the wide variety of tariff lines offered by Chile. India has offered concessions to Chile on 1031 tariff lines at an eight-digit level with a margin of preference (MoP) ranging from 10% to -100%. Under the expanded PTA, of the 1,798 tariff lines, Chile has offered 100% MoP on 556 tariff lines, 80 % MoP on 736 tariff lines, 60% MoP on 291 tariff lines and 30 % MoP on 215 tariff lines.
Today, Chile is India’s 4th largest trading partner in the LAC (Latin America and Caribbean) region. India’s bilateral trade with Chile stood at $2.64 billion during 2015-16 with exports of $0.68 billion and imports $ 1.96 billion. A PTA between India and Chile was signed in March, 2006. The said PTA came into force with effect from August, 2007. During 2006-07, Chile was ranked 51st as an export destination for India. Bilateral trade during 2006-07 was $2.3 billion. Trade dynamics changed after the PTA came into force from September 2007. Bilateral trade registered a growth of 58.49% from 2006-07 to 2014-15. Bilateral trade during 2014-15 stood at $3.65 billion with exports at $0.57 billion and imports at $3.08 billion respectively. “Almost 91% of trade between the two countries is in commodities, specifically copper, which is close to $1.7 billion, comes to India,” Barbe said. Copper is the main import commodity on which the Indian side has offered 50% MoP. “The MoP of 50% on copper has been offered to Chile keeping in mind that the refined copper is an intermediary, which is an important input for many sectors of our economy. The demand for this item is expected to grow exponentially beyond current domestic capabilities,” said a government official.
Since 2007, India and Chile have had a PTA, but bilateral trade has fallen to $2.87 billion. “In 2009, we agreed to start negotiations for widening the agreement, which would include new products, subject to tariff preferences, and deepening in matters related to Rules of origin, sanitary &phytosanitary measures, and technical barriers to trade (TBT),” the diplomat added.
Andrés Rebolledo, director general for international economic relations, foreign affairs ministry, Chile, “Considering the significant size and growth of the Indian market, there is great potential for fruits from Chile to increase their market share. The expanded PTA will increase preferential tariffs for both countries. Chilean fruits that will benefit from this process include avocadoes, clementines, grapes, apricots, cherries, nectarines, raspberries, cranberries and kiwis.”
(Ref. http://www.financialexpress.com/economy/india-chile-pta-to-be-signed-soon-exports-set-to-double/366059/ dated 03.09.2016)
|
BACK |
DGFT asks exporters’ incorrectly availing simultaneous benefit of 0% EPCG & SHIS to surrender benefits
New Delhi, Sep 9 (KNN) Based on the reports received by Directorate of Revenue Intelligence and other exporters, the Directorate General of Foreign Trade (DGFT) has warned the exporters, who have incorrectly availed simultaneous benefit of zero percent EPCG and SHIS, to surrender one of the benefits subject to certain conditions.
A time frame of 9 months from provision of option by DGFT is allowed to exporters for returning the benefits.
In a notification, DGFT said, “This Directorate had received references from Directorate of Revenue Intelligence and various exporters, on the subject of incorrectly issued simultaneous benefits of Status Holder Incentive Scheme (SHIS) and Zero Duty EPCG Authorization under Foreign Trade Policy 2009-14.”
The representations have been examined by this Directorate in consultation with Department of Revenue and it has been decided that exporters who have been issued or availed such simultaneous benefit of these schemes shall be allowed flexibility, to the extent specified in this public notice, to choose one of the two schemes.
However, the option to return the benefits is subjected to certain conditions.
The amount shall be paid back to Government in cash. The facility of debiting the amount in valid freely transferable duty credit scrip issued under Foreign Trade Policy or in valid SHIS scrip held by the original holder to whom it was issued, shall be allowed for paying the refund part. However, interest part shall be always paid in cash. (KNN Bureau)
(Ref. http://knnindia.co.in/news/newsdetails/sectors/dgft-asks-exporters-incorrectly-availing-simultaneous-benefit-of-0-epcg-shis-to-surrender-benefits dated 09.09.2016)
BACK |
|
Government to incentivisefertiliser retail outlets to check leakages
In an attempt to ensure that subsidisedfertilisers reach the intended beneficiaries, India’s ministry of chemicals and fertilizers will incentivise retailers for acknowledging transactions and issuing sale receipts to farmers.
The incentive for capturing such information by retailers from producers and dealers will be Rs.50 for every tonne of urea sale. The government will ask manufacturers to put point-of-sale (PoS) devices at all retail outlets.
The government wants to put up PoS devices at 150,000 retailers. Such measures will help the National Democratic Alliance government’s plans for direct benefit transfer (DBT) of fertiliser subsidies by stemming leakages. A provision of Rs.70,000crore for fertiliser subsidies has been made in the Union budget of 2016-17.
The PoS devices will also help capture essential information which in turn will allow the ministry of fertilizers to share the fertiliser purchase history of farmers under DBT scheme with banks and financial institutions.
“According to the provisions of the Fertilizer Control Order, every dealer is required to issue credit memo to the purchaser of fertiliser. However, on-the-ground feedback suggests that this provision is not being followed properly by retailers,” said a senior government official on condition of anonymity.
The fertiliser department launched the Fertilizer Monitoring System in May 2007 to track fertiliser movements from production or import points to retailers, the last points of sale. To leverage the far-reaching mobile technology and have a better visibility of transactions till the retailer level, a mobile application called the mFMS was also introduced in November 2012.
According to information available on fertiliser ministry’s website, the government announced an incentive of Rs.50 per tonne to retailers for acknowledging fertiliser receipts via mFMS. Currently, producers hand over the incentive to retailers as the government is forwarding the subsidy amount directly to companies’ accounts.
However, the government is now planning to send the incentive straight to a retailer’s account as the process has not taken off even after four years, said another government official who also did not want to be named.
“During its inception in 2012-13, not even 7% of the entire fertiliser transactions were acknowledged via mobile. It got worse in the consecutive years and dropped to less than 1%. In the current financial year, about 8.5% of fertiliser transactions have been acknowledged to date,” said the second official.
To finalise a time-bound action plan, a meeting has been called by Vijay Shankar Pandey, secretary, department of fertilizers, on 16 September for installation of devices at the earliest.
The government plans to tweak the model adopted for DBT of fertiliser subsidies. Under DBT, a beneficiary gets subsidy amount in her account. In case of fertiliser subsidy, the government is contemplating to transfer the subsidy directly to manufacturers.
“The current exercise is aimed to reach 100% acknowledgement wherein the entire sales will be captured at the retail level,” added the second official.
InfraCircle on 8 July reported that the government has decided to conduct a pilot in eight districts in the coming rabi season and in another eight districts in the next kharif season to capture authenticated retailer sales and buyer details as a precursor to DBT in fertiliser.
A third government official, requesting anonymity, said the entire exercise is to track the real beneficiaries which will help in rolling out of DBT in the fertiliser segment.
Queries emailed to the ministry of chemicals and fertilizers on 8 September remained unanswered.
Analysts believe that making the PoS devices installation mandatory will help in multiple ways.
“Earlier, we have seen that dealers have been hesitant in filing input related to acknowledgement receipts as they are not that tech savvy. It had also resulted in piling up of subsidy receipts. So this is a much-required step,” said K. Ravichandran, senior vice-president and co-head, corporate ratings, at Icra Ltd, an investment information and credit rating agency.
The model of giving incentives straight to retailers will also boost chances of their acknowledging the receipts, he added.
India’s annual demand for urea is around 31 million tonne (MT). The country witnessed a record production of 24.5 MT of urea for the financial year ended 31 March 2016.
(Ref. http://www.vccircle.com/infracircle/government-to-incentivise-fertiliser-retail-outlets-to-check-leakages/ dated 09.09.2016)
BACK |
|
DYES & DYE INTERMEDIATES: DYING TO COLOUR THINGS DIFFERENTLY
Introduction
Dyes are natural or synthetic substances that add color to various materials, and have a wide array of industrial applications including textiles, leather and footwear, paper, and food industries. Dyes are typically applied using an aqueous solution, and may require a mordant to quicken the binding process. Dye intermediates, on the other hand, are petroleum downstream products, which are further processed to make finished dyes and pigments. Dye Intermediates serve as an important raw material for acid, reactive, and direct dyes. Here, we take a sneak peek on the dyes & dye intermediates market’s current and potential growth scenario, and other facts figures about this lucrative segment.
Continuous research, beginning in the 20th century and continuing until now, has led to the discovery of every imaginable color of dye. Modern dyes have become indispensable tools for several industries. Dyes can be used as colorants for polymers, textiles and biotechnology industries, and as inks or tinting agents. Dyes are available as dry powders, granules, pastes, liquids, pellets, and chips.
Other industries that use dyes include paper and pulp, adhesives, art supplies, beverages, ceramics, construction, cosmetics, food, glass, paints, polymers, soap, wax biomedicine, among others.
Current Market Scenario
The market demand for dye and dye intermediates is expected to project a CAGR of 4.3%, growing from 1.19 MMT in 2016, to 1.47 MMT in 2021. The organized sector dominates the dyes & dye intermediates market, with a 69% share of the total market. The unorganized sector, on the other hand, controls the remaining 31% of the market share. This growth is attributed to a high demand for leather, textiles and ink industries, which are expected to register a CAGR of 4%, 6%, and 11%, respectively. Dye exports are also expected to increase by 6.1%, as production bases shift to lesser developed nations like India, because developed nations adopt stringent pollution control measures.
The dyestuff sector is India’s second highest export sector in the chemical industry. The Indian dyestuff industry constitutes about 1,000 small scale units and 50 large organized units, which produce around 1,30,000 metric tons of dyestuff. Maharashtra and Gujarat account for 90% of dyestuff production in India, owing to a higher availability of raw materials and are more dominant textile industry. Textiles, paper, plastics, printing ink and foodstuff sectors make up major users of dyes in India. The textiles sector consumes around 80% of the total dye production, because of the high global demand for polyester and cotton.
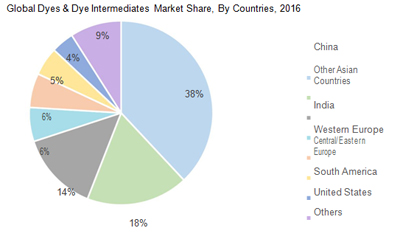
Currently, India contributes about 6.2% of the global market share, projecting a CAGR of more than 13% in the last decade. The dye market is mostly dominated by reactive and disperse dyes. In Asia, China, Korea and Taiwan remain key players in disperse dyes, while India leads the production of reactive dyes, owing to ready availability of intermediate vinyl sulphone in the country.
Recent Developments
- Fungal dye decolourization:
-
Recently, dye decolourization using biological procedures has become more popular to counter the environmental threats of dyes released by textile industries. Fungal dye decolourization uses fungi to decolorize dye wastewater. It is fast becoming a promising alternative to usual wastewater treatment processes, as the procedure is inexpensive and can be used for a wide range of dyes.
- Reactive dyes are renowned for light and pale shades. However, several environmental problems, including higher alkalinity, colored effluence, and larger volumes of electrolytes, are associated with reactive dyeing. To solve these problems, industries took many efforts, including:
- Modifying the dye to increase fixation by enhancing the reactivity.
- Modifying the dye to increase the substantives, so that electrolyte requirement was reduced.
- Modifying the cellulose substrate- cationisation of cellulosic materials.
Costs
The total world-wide production of cotton is estimated to be 21 x 106 TPA. (Metric tons per annum). The amount of reactive dye used for cotton coloration is estimated to be 120,000 TPA, of which about two thirds is dyed by exhaust technology.
The reactive dye business, owing to its maturity, is very competitive and price sensitive. As older dye technologies have moved out of patent, these have been taken up by manufacturers in a developing world, driving down manpower costs and total production costs. Therefore, a large proportion of cotton processing has shifted to relatively cheaper and less environmentally conscious economies. Further cost reduction and increasing awareness of environmental benefits has led to proposed modifications in the rinsing process, after dyeing. Approximately, half of the energy and water consumption is attributed to the rinsing process after dyeing. Thus, there is much scope for cost reduction in rinsing operations.
Future Aspects
The growth of dye sector in the future will depend on the performance of end-user industries (paints, textiles, printing inks, paper, plastics and foodstuffs). Changing customer preferences, boom and expanding infrastructure in certain parts of the world create a new market opportunity for the dye industry, which is likely to witness innovations in dying technologies, advances in technical expertise and R&D achievements. The high use of cotton, polyester and banned vat and AZO dyes in some countries have paved the way for reactive and disperse dyes. These two dyes are expected to lead the dyes & dye intermediates market in the future.
To learn more about the industry, request a sample today.
DISCLAIMER
Mordor Intelligence Reports and their contents, including all the analysis and research containing valuable market information, are provided to a select group of customers in response to orders. Our customers acknowledge when ordering that Mordor Intelligence strategic analysis services are for our customers’ internal use and not for general publication or disclosure to third parties.
Quantitative market information is based primarily on interviews and therefore, is subject to fluctuation. Mordor Intelligence takes no responsibility for any incorrect information supplied to us by manufacturers or users.
No part of this strategic analysis service may be given, lent, resold or disclosed to non-customers without written permission. Reproduction and/or transmission in any form and by any means including photocopying, mechanical, electronic, recording or otherwise, without the permission of the publisher is prohibited.
ABOUT US
Mordor Intelligence is a global market research and consulting firm. Our singular focus is to provide research insights for business success. Our research team has expertise in diverse fields like Agriculture, Healthcare, ICT, Chemicals, Manufacturing, Logistics, Electronics and Automotive. However diverse the expertise maybe, everyone in our team shares one common trait - we love data and we love providing solutions to clients using that data even more. Seeing your business flourish based on our solutions and strategy is what we love the most.
For information regarding repmissions and sales, please contact:info@mordorintelligence.com |
|
BACK |
The Indian Chemical Industry, at a Glance
By Pooja Tanna, Research Analyst, Visionary Science Practice, Frost & Sullivan
 |
| Pooja Tanna is a Research Analyst for the Visionary Science Practice at Frost & Sullivan, and works in the field of Chemicals, Materials and Foods. She has worked extensively on Chemicals, Pharma, Food and Solvents related project for different regions like India, Middle East and APAC. In her projects, Pooja had covered market mapping, product and company profiling, competitive analysis, trends, forecasting, supply and demand analysis. |
|
An Overview
India is the sixth-largest producer of Chemicals in the world and third-largest in Asia with an array of 80,000 commercial products. The Indian chemical industry offers varied prospects for investors from both India and the world over.
Apart from the basic chemicals like organic and inorganic chemicals, the chemical sector consists of several other categories such as Plastics, Petrochemicals, and Specialty Chemicals like Drugs and Pharmaceuticals, Dyes and Pigments, Pesticides, and Agrochemicals. India has an edge in the specialty chemical sector, which is expected to grow at a Compound Annual Growth Rate (CAGR) of 15% through 2020. The industry is also the third-largest global producer of agrochemicals and accounts for 16% of the world’s dye production.
The chemical industry, especially specialty chemicals, is an intensively knowledge-driven industry. India, with its flourishing skilled manpower and end-user segment, is thus an emerging hub for manufacturing. Global companies are looking to leverage India’s key advantages, which range from large pools of skilled manpower, quality manufacturing processes, relatively easy access to key raw material, and low-cost production facilities, making the country a profitable destination for manufacturing of specialty chemicals. Apart from its inherent benefits, Government policies like ‘Make in India’ and the roll out of the Goods and Services Tax (GST) will help improve ease of doing business in the country and drive further investments in the Indian chemical industry.
With flourishing segments in specialty chemicals including water treatment, surfactants, agrochemicals, pharmaceuticals, etc., growth is expected to boost the penetration of high value chemical products tapping the manufacturing potential in the country and, thus, taking a step toward becoming a global hub of chemical manufacturing.
Industry Segmentation
The Indian chemical industry can be broadly classified into the following segments with basic or bulk chemicals accounting for the largest share of about 40%, followed by agrochemicals (20%) and specialty chemicals (16%).
Exhibit 1: Chemical Industry — Segment Mapping, India (2015), US $144 Bn
 |
- Basic chemicals (includes organic chemicals and inorganic chemicals)
Basic organic chemicals: Those majorly produced in India include Methanol, Aniline, andderivatives of Methanol like Formaldehyde, Acetic acid, and phenol and have varied applications at industrial level. These mainstream chemicals nearly account for two-third of the Indian chemical industry; the remaining includes various other chemicals like Chloro methane and Ethyl acetate.
Basic inorganic chemicals: Some of the basic inorganic chemicals are Caustic Soda, Chlorine, andSoda ash belonging to the Chlor-alkali industry; these have application in several industries like aluminum, soap, detergent, tire, rubber, pharmaceutical, etc. Organic and inorganic chemicals are expected to grow at 9% and 6-7%, respectively, in the near future, mainly driven by the end-user segments.
- Specialty chemicals: Thespecialty chemicals segment is one of the fastest growing segments,growing at the rate of ~15% per annum, worth US $23 Billion in 2015, and expected to reach US $90 Billion by 2020. These are also known as performance chemicals, derived from basic chemicals with flexibility to perform particular function and play important roles in the development of new products, identifying customers’ needs, and delivering solutions. In simple words, it is acknowledged by ‘what they do’. The key specialty segments in India are Polymer additives, Paints and Coating, Construction Chemicals, Surfactants, Flavor, Water treatment, Agrochemicals, Pharmaceuticals, Biotechnology, etc. Despite witnessing the highest growth rate, per capita consumption of specialty chemicals is the lowest in India when compared to other emerging markets. The following exhibit gives an overview of the specialty chemicals market in India
Exhibit 2: Overview of Specialty Chemicals Market in India
Growth in the Indian specialty chemicals segment is largely driven by the robust domestic demand from the key industries like Pharmaceuticals, Agrochemicals, and Constructive Chemicals. Secondly, need for customized application development in Paints and Coatings, Dyes etc. and industries like
textiles calling for products with higher quality and better performance products like wrinkle free, reflective glass etc.
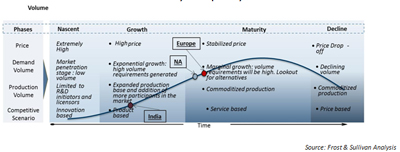
Exhibit 3: Lifecycle of Specialty Chemicals
Exhibit 4: Comparison of Key Specialty Chemical Segments in India
| Segment |
Value (INR Crore) |
Key Sub-segments driving growth |
Penetration of Specialty
Products*
|
CAGR to
2020
|
| Paints and Coatings |
35,500 |
Protective Coatings, especially
wood coatings and automotive
coating (metal/plastic)
|
Medium |
15-18% |
| Dyes & Pigments (Colourants) |
28,100 |
High Performance Pigments
(automotive), Textile Pigments,
|
Medium |
12-14% |
| Agrochemicals |
28,900 |
Biocides, Insecticide |
Low |
9-10% |
| Adhesives |
13,600 |
Polyurethane adhesives, Hot
Melts,
|
High |
14-16% |
| Home Care Surfactants |
11,500 |
Laundry Care, Dishwashing |
Very High |
22-25% |
| Construction Chemicals |
4,500 |
Tile Adhesive, Waterproofing |
Low |
15-18% |
| Water Treatment |
5,000 |
Industrial Water Treatment |
Medium |
6-8% |
| Polymer Additives |
2,750 |
Plasticizers, Heat Stabilizers |
Medium |
8-10% |
| Personal Care Chemicals |
4,000 |
Bath & Shower, Hair Care |
Low |
10-12% |
| Flavours& Fragrances |
3,800 |
Natural Variants, |
Low |
10-12% |
Industrial & Institutional
Cleaners
|
1,300 |
Disinfectants, Surfactants |
Medium |
16-18% |
| Rubber Chemicals |
1,500 |
Tyres |
High |
12-14% |
| Other |
33,500 |
N/A |
|
|
| Total |
174,000 |
|
Medium |
14-18% |
- Petrochemicals: Petrochemicals are also included in the Indian chemicals industry.Petrochemicals, also known as petroleum distillates, are chemical products derived from petroleum. The common source for its production is hydrocarbons derived from coal or natural gas, or some other fossil fuels, or some renewable sources such as sugarcane or corn. Other unconventional feedstocks used are shale gas, coke, pet coke, etc.
The two main classes of petrochemicals are Olefins (ethylene and propylene) and aromatics (benzene, toluene, and xylene); hence they form major building blocks for a wide range of end products like solvents, detergents adhesives, polymers and oligomers, etc.
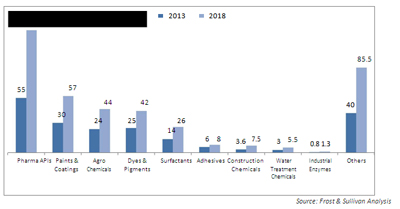
Exhibit 5: Specialty Chemical Segment — Percentage Revenue by Key Sub Segments, India (2015)
The chemical industry is extensively knowledge-driven, requiring continuous investments in R&D. The upcoming Government initiatives like integrated plants for petrochemicals and chemicals, approval for 100% FDI flow in the chemical industry, improvement in infrastructure, strong economic growth contributing 7% of Indian GDP, global companies investing to leverage lost-cost manufacturing, and development of new products in the market are some of factors driving the Indian chemicals industry.
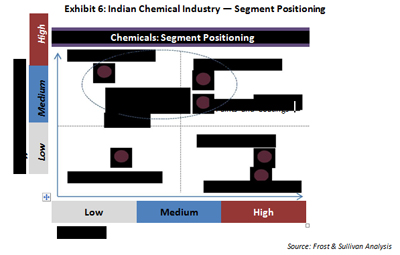
Exhibit 6: Indian Chemical Industry — Segment Positioning
Investment Focus:
- Development in Nano / Biotech: New evolving applications in the end-user segment, which are highlyresult-oriented in areas like electronics, foods, chemicals, textiles, etc.
- Sustainability and Green Chemistry: There’s a growing preferences for chemicals and products thatare environment-friendly, thus emphasizing on sustainable development. The goal for most companies is to move closer and closer to zero effluent plants and reduce environmental foot-print of the industry as a whole.
- Increasing Expenditure on R&D: A huge amount of investment is essential in the technical aspect ofmolecule. In 2014-2015, investments from the top 25 pharmaceutical companies like Lupin, Cipla, Dr. Reddy’s, Biocon, Aurobindo, etc. has increased to 28.8% from 20.6% in the previous year. The key focus area for Indian chemical companies include new molecule development / innovations in agrochemicals with low dosage, high potency, bio pesticides, and other varied allied products.
Industry Challenges
- Lack of infrastructure and power shortage: Lack of a strong multi-modal infrastructure, given theconnectivity issues at ports, railways, and roads, obstructs the manufacturer’s bandwidth in procuring raw materials with global peers, which in turn negatively impacts the production of chemicals. Logistics and connectivity hindrances from the supplier to the manufacturers are a major cost component, especially in the bulk chemicals space. For e.g., Soda ash manufacturers are located in Gujarat and ~40% of the end-user industries like glass, detergents, etc. are based in the South. As a result, a lot of South-based customers tend to look at imports as a potential substitute. Another issue is the power supply to manufacturing location. Continuous supply of power is another requisite for efficient production. Although many big companies have started investing in captive power plants, it is typically not cost-effective and increases the cost of production significantly. Small and medium-sized companies are severely affected by uninterrupted power supply issues, often resulting in lowered capacity utilization among these industry participants.
- Lack of infrastructure and power shortage: Lack of a strong multi-modal infrastructure, given theconnectivity issues at ports, railways, and roads, obstructs the manufacturer’s bandwidth in procuring raw materials with global peers, which in turn negatively impacts the production of chemicals. Logistics and connectivity hindrances from the supplier to the manufacturers are a major cost component, especially in the bulk chemicals space. For e.g., Soda ash manufacturers are located in Gujarat and ~40% of the end-user industries like glass, detergents, etc. are based in the South. As a result, a lot of South-based customers tend to look at imports as a potential substitute. Another issue is the power supply to manufacturing location. Continuous supply of power is another requisite for efficient production. Although many big companies have started investing in captive power plants, it is typically not cost-effective and increases the cost of production significantly. Small and medium-sized companies are severely affected by uninterrupted power supply issues, often resulting in lowered capacity utilization among these industry participants.
- Feedstock availability: Feedstocks are the basic building blocks for all chemical products andsustained availability of feedstock at competitive cost is a key concern for companies in the chemical industry; for e.g., crude oil, natural gas. These feedstocks are generally available in India at higher prices compared to costs in China, the Middle East, and Southeast Asian countries like Thailand.
- Regulatory challenges: The US and the EU together account for about 25% of the global chemicalindustry and India exports specialty chemicals to these developed regions. It, thus, becomes necessary to meet the target countries’ regulations, like REACH (Registration, Evaluation, and Authorization of Chemicals) in the EU. REACH regulations lead to additional time, effort, and money for Indian companies to register chemicals and to do business with the EU, thus increasing the price of exports from India to the EU. On similar lines, the US also imposes norms as per Toxic Substances Control Act (TSCA) that requires testing of chemicals coming into the US.
Feedstocks are the basic building blocks for all chemical products andsustained availability of feedstock at competitive cost is a key concern for companies in the chemical industry; for e.g., crude oil, natural gas. These feedstocks are generally available in India at higher prices compared to costs in China, the Middle East, and Southeast Asian countries like Thailand.
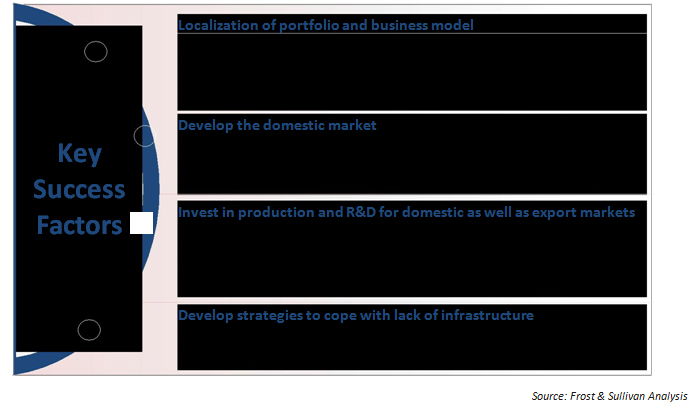
Key Success Factors for New Entrants
Exhibit7: Targeting the Indian Market — Key Success Factors
To summarize, the Indian chemical industry stood at US $144 Billion in 2015 and is expected to reach US $280 Billion by 2020 growing at a CAGR of about 14%. Significant untapped potential in the domestic market, low-cost manufacturing, and a large pool of skilled manpower make India an ideal destination for investments in the chemical industry. Furthermore, Government policies like Make in India, fiscal incentives, development of mega parks, etc. will help make India an attractive investment destination for the chemical industry.
|
BACK |
Amendment in Import Policy of Urea under ITC (HS) code 3102 10 00 of chapter 31 of ITC(HS), 2012-Schedule-1(Import Policy)
|
EPC/LIC/UREA |
12 th September 2016 |
|
Amendment in import policy of Urea under ITC (HS) code 3102 10 00 of Chapter 31 of ITC (HS), 2012 – Schedule – 1 (Import Policy).
|
|
Dear Members,
Kindly note that the O/o DGFT, New Delhi has issued Notification No. 26/2015-2020 dated 09/09/2016 regarding amendment in import policy of Urea falling under ITC (HS) code 3102 10 00 of Chapter 31 of ITC (HS), 2012 – Schedule – 1 (Import Policy).
As you are aware, currently import of Industrial Urea / Technical Grade Urea (TGU) is allowed subject to Actual User condition. However, with this notification, the Actual User (AU) condition on import of Industrial Urea / Technical Grade Urea (TGU) is being removed and import of Industrial Urea / Technical Grade Urea (TGU) shall be free.
Members are requested to take note of the same. For further information, Notification No. 26/2015-2020 dated 09/09/2016 may be downloaded using below link-
http://dgft.gov.in/Exim/2000/NOT/NOT16/noti2616_English.pdf
Thanking You,
Yours faithfully,
(S.G. BHARADI
Executive Director
Encl : noti2616_english(UreA)
|
BACK
|
Issuance of Free Sale & Commerce Certificate by DGFT RA's to Merchant Exporters
|
EPC/LIC/FREESALECERT |
21st September 2016 |
| ALL MEMBERS OF THE COUNCIL
|
|
Issuance of Free Sale & Commerce Certificate by DGFT RA's to Merchant Exporters
|
|
Dear Members,
We would like to inform you that the O/o Directorate General of Foreign Trade, New Delhi has issued circular no 02/2015-20 dated 15/09/2016 regarding issuance of Free Sale & Commerce Certificate to Merchant Exporters.
As you might be aware, Para 2.37 of HBP provides for issuance of Free Sale & Commerce Certificate for export of items (not covered under Drugs & Cosmetics Act, 1940) which have usage in hospitals, nursing homes and clinics, for medical and surgical purposes and are not prohibited for export. Further, RA’s may also issue, on application, Free Sale & Commerce Certificate for export of any other item which is not restricted or prohibited for exports. Validity of such a certificate is two years from date of issue.
However, there have been some concerns regarding pro-forma of such certificate. With this circular, the guidelines of application for issuance of Free sale and Commerce Certificate to Merchant Exporters are provided. Now Free Sale & Commerce certificate can be issued by DGFT RA’s to merchant exporters, if they provide details of actual manufacturers of the item in Annexure “A” of ANF-2H.
Relevant members are requested to take note of the same. For further information, may be download the circular using below link-
http://dgft.gov.in/Exim/2000/CIR/CIR16/pc02_2017.pdf
Thanking You,
Yours faithfully,
(S.G. BHARADI
Executive Director
|
BACK
|
(MEIS)—Additions/Amendments in Table 2 of Appendix 3B
| EPC/LIC/DGFT/MEIS-AMENDMENTS |
22nd September 2016 |
| ALL MEMBERS OF THE COUNCIL
|
|
(MEIS)—Additions/Amendments in Table 2 of Appendix 3B
|
|
Dear Members,
We would like to inform you that O/o DGFT, New Delhi has issued Public Notice No. 32/2015-2020 dated 22nd September 2016 notifying amendments in MEIS Scheme of Chapter 3.
As you are aware, the Council acts as an interface between the member-exporters and the Ministry and has regularly taken up the issues of member-exporters which are related to DGFT/ CBEC/ other Depts.
A-Additions in Table
We are glad to inform you that the O/o DGFT has taken cognizance of Council’s representations and has included following products in the MEIS scheme:
| Sr. No. |
Export Product/ Item |
HS Code |
MEIS REWARD (%) |
| 1 |
Palmitic Acid- |
29157010 |
2 % |
| 2 |
Potassium chlorate |
28291920 |
2 % |
| 3 |
Isobornyl Acetate |
29153920 |
2 % |
| 4 |
ALPHA PICOLINE(2-METHYL PYRIDINE), |
29333912 |
2 % |
| 5 |
GAMMA PICOLINE(4-METHYL PYRIDINE) |
29333913 |
2 % |
B-Amendments in rates of MEIS schedule in Table
From products under Chemexcil purview, the rate of “ATTARS OF ALL KINDS IN FIXED OIL BASE (HS Code 33019031) has been amended from 2% to 3%.
Members are requested to take note of these amendments and for additional details may download Public Notice No. 32/2015-2020 dated 22 September 2016 using below link:
http://dgft.gov.in/Exim/2000/PN/PN16/PN3216_Eng.pdf
Finally, we would like to assure you that the Council always strives to take up the issues of member-exporters which will boost exports. I also take this opportunity to request the member-exporter to share the information/ issues whenever they are requested by the Council which will also enable us examine the same and deliberate with concerned depts.
Thanking You,
Yours faithfully,
(S.G. BHARADI
Executive Director
|
BACK
|
|